Symbology
Data Considerations
The key concept in distinguishing nominal-level thematic maps from topographic maps is that the focus of the map's content is on one layer or one relationship between layers. The core symbology question is whether the symbology for the layer in question depends on an attribute table field or is independent of its attributes.
Some nominal layers can be symbolized just based on the fact that their features are different from the features in other layers. Whatever made the features different enough that the data sources store them in separate layers is justification enough that they should have different symbology, too. This is one data situation likely to result in the use of the single symbol symbology option (see below). Generally speaking, there is no need to even look at the attribute table.
Two types of attribute data lend themselves readily to nominal-level maps. The most obvious is text data in which the relevant field in the attribute table contains a grouped nominal variable. The other possibility is an attribute table text field in which every value is different from all the others.
More challenging for nominal-level mapping is basing the symbology on a data field containing numbers. One type is weak ordinal number values, representing relative quantities. Most of the time the best use of such data is for ordinal-level maps (see the next unit). However, there may be situations in which you want to highlight, and therefore symbolize, only one of those groups. Similarly, use a quantitative field in which every value is different to select one (or maybe a few) observation(s) with a specific value (highest, lowest, median, etc.) in order to assign it an appropriate symbol.
Symbol Options
Single Symbols
In a nominal level map of a single symbol it is important to make that symbol the primary feature of the map, making it stand out from background colors or any basemap. Use size, color or intricate design to make that primary symbol draw the viewer’s attention. For example, mapping the locations of a supermarket chain’s stores, the company logo (or some variation on it) would be an appropriate symbol. In fact, it might be more important to select the primary symbol before any background symbology and choose the background symbology to complement the primary symbol.
Another use of the single symbol option is applying that symbol to a subset of the features in a layer. If the choice of features to apply it to is based on an attribute table field, then the options become more limited. If the field contains a grouped variable (weak ordinal or nominal grouped), then the symbology could apply to one class in that field. The symbology strategy would be to assign symbols with no color or symbols with a size of "0" to the other classes within that layer.
If the desire is to symbolize one feature from the layer where that feature is chosen based on a text field value or quantitative field value (where all the values in the field are unique), there is one preferred technique for identifying that feature. If you right-click on that layer's name and choose Properties from the menu, one of the tabs in the Layer Properties dialog is "Definition Query." To use this capability, you must learn the "Query Builder" which is beyond the scope of this discussion but not difficult to learn.
The final application of the single symbol option is when features are stored in multiple layers with each layer getting a single symbol. This is especially effective if there are only a relatively few features; then each feature/layer could be mapped with a different symbol, perhaps a symbol suggestive in some way (such as color or shape) of what the feature is. That, though, leads us to the discussion of the unique values symbology option.
Unique Values
A nominal level map of unique values has the features in one layer participate in a larger relationship, represented by the map theme. Even though they are all the same type of feature, there is some reason to use symbology to show them as being different. The usual approach is to group the features in that layer into a smaller number of subsets, each subset getting a different symbol. The less common approach is for each feature to get its own different symbol.
The main symbology advice with unique values symbols is to choose the symbols to mimic the relationships you are trying to depict. If that relationship emphasizes similarities, then the symbols can be similar in some way, but they must still be different enough to tell apart and different from the map’s background. If the relationship is based on differences, then colors and shapes can help to distinguish them. Be careful, though, not to use differences that imply ordinal or quantitative differences.
In one application of this, the unique values field is a text field in which each feature has a different text value. This is redundant because all you will see are lots of different colored versions of the same symbol randomly assigned to the features. All that creates for the viewer of your map is confusion. However, if there are multiple map features of the same type that you want to differentiate, another effective strategy is to give them all the same symbol and then label each feature with the text in that one field, an easy job for ArcMap.
The more common application of the unique values symbology is with a nominal grouped (classified) variable. Choose the Unique Values symbols option and the nominal grouped variable as the Value Field. Below the symbol window in the middle of the dialog box is an "Add All Values" button that will make ArcMap list each different value. You can expect the same randomly colored variations on one simple symbol, which you can then alter individually to better represent each class. The group values are often descriptive enough to inspire specific symbol choices.
A weak ordinal variable can be used as the Value Field for the unique values symbology option, but that is treading very close to ordinal level symbology, so you really must know the reason for the symbol choices you make.
Similarity to Topographic Symbology
Nominal level mapping can take advantage of lessons learned in the world of topographic mapping. For example, if symbols are well chosen, with colors or shapes clearly representing the map's content described in the title or caption, then a legend might be superfluous. Remember that the key to a thematic map's effectiveness is keeping it simple so that the message shines through.
One way to test the concept of the nominal thematic map, in fact, is to open a USGS quadrangle in Adobe Reader and turn off all layers except one. Choose a layer that is very specific and themed, such as Structures or Wetlands or Woodland, and notice that you are seeing it completely out of the context of the road network or political boundaries. Similarly, leave only two layers visible, such as Wetlands and Hydrography or Woodland and Hydrography, in order to see the spatial associations between the two map layers.
Applications for Nominal Maps
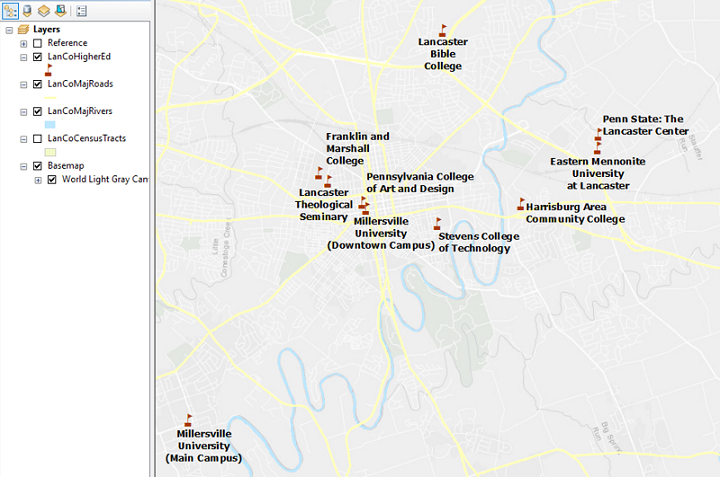
The GIS applications of nominal-level mapping are many. Often maps can be used to add visual context to a story or historical narrative, for example. Naming locations in the narrative or adding information to a basemap for context purposes are typical uses. Historical works often need such context if boundaries or travel routes have changed, if earlier names have been replaced with current ones or if the area in question is unfamiliar to the map’s intended audience. As discussed earlier, this is bordering on topographic mapping; the degree of focus on the map’s thematic purpose is the distinguishing characteristic.
Another common application of nominal-level mapping is to map identifiable incidents or sites, such as crimes, tornado touchdowns, gas wells or sporting event locations. The same concept can be extended to linear or area features. Maps of one or more geological fault lines or wildfire burn zones would fit those descriptions. All these examples represent situations where the nominal features are isolated and separated from other features in the same layer. In the cases of areas and lines, the features may even overlap.
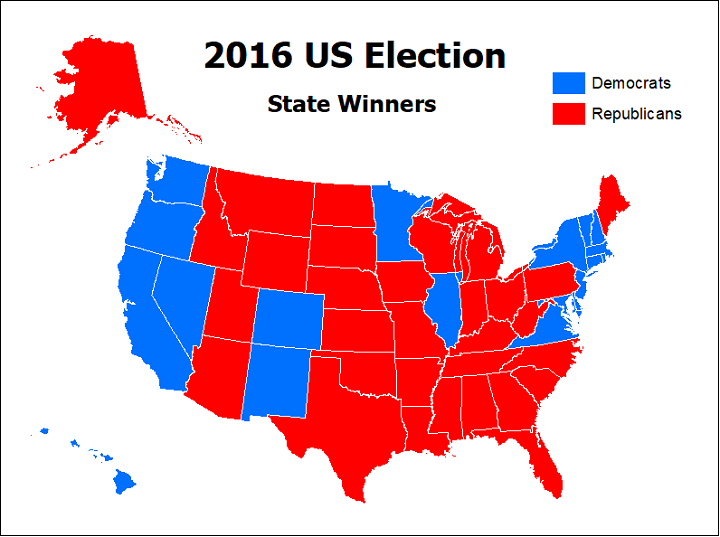
An alternative to the latter scenario is to use a layer of adjacent, contiguous areas. The easiest example is a layer of the 50 (or 48 contiguous) US states. If the attribute table for that layer includes one of the types of data described above, that can constitute an effective nominal-level map. An example is a map of election results from a recent presidential election: each state can be colored according to whether the Republican or Democratic candidate won that state. This example also demonstrates the value of using well-established color associations as symbology choices.
From our work with topographic mapping earlier in the semester, the procedures for making the symbology selections for all these scenarios should be known. The challenge is to apply the design concepts discussed here to your maps. The scenarios vary widely because they depend on the map’s purpose and the nature of the data.
Example in ArcGIS
Election Results Map Procedure
- Add a map layer of the US states to ArcMap. Check to see how the states are identified in the layer’s attribute table.
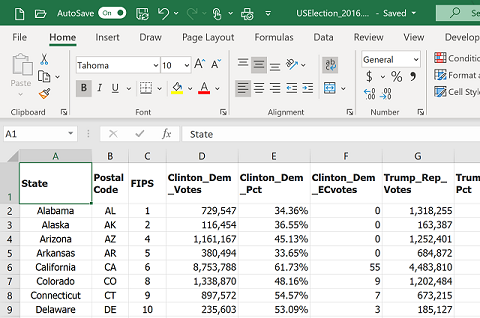
- Download a table of election results (it is more reliable to save the data in CSV format) that contains at least these two fields:
- The names of the states, or their two-letter abbreviations or their FIPS codes for identification. No matter which field we plan to use, there must be a comparable field in the US states attribute table with the same data format, capitalization or spellings.
- The election results recorded in such a way that it is easy to identify the winning party.
-
- The next step is to "join" the data table to the layer's attribute table. In ArcMap, here is how we access the Join dialog.
-
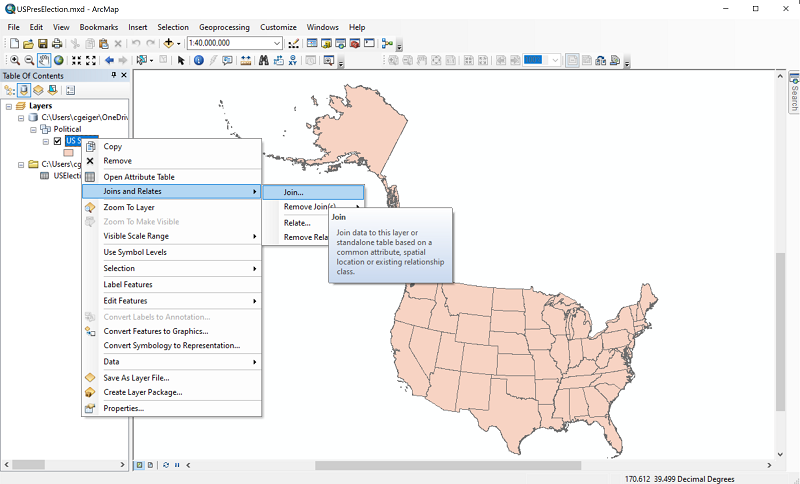
- The Join dialog looks like this.
-
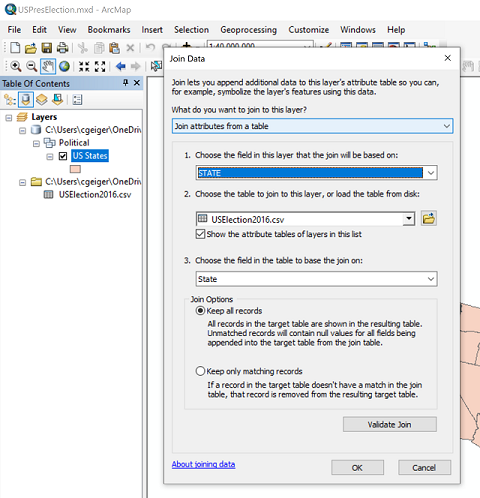
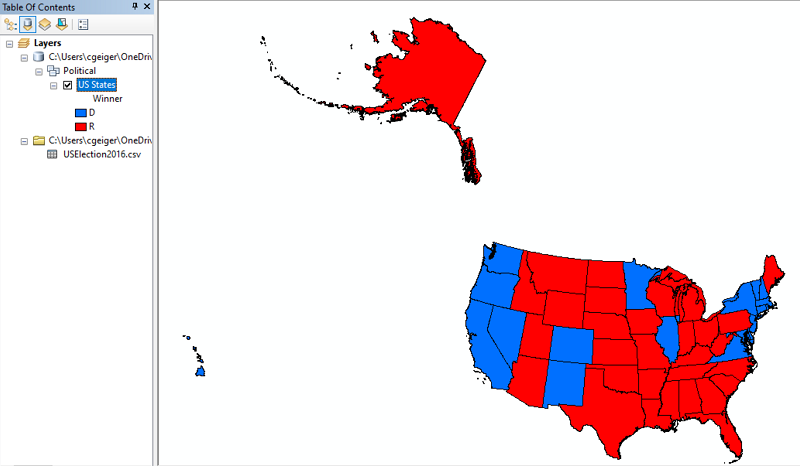
- Symbolize the US states layer using the election results field, coloring the Republican-won states red and the Democrat-won states blue.
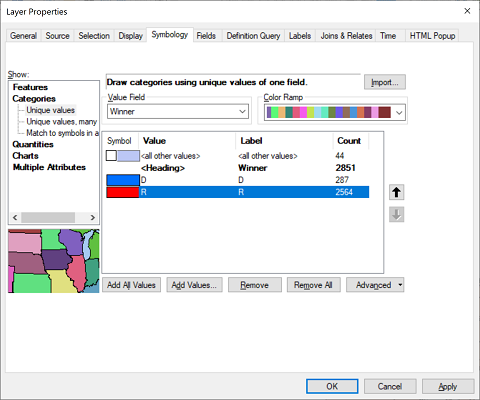
- In the Symbology dialog, choose Unique Values for the representation.
- In the option to select the Value Field, choose the field that contains the election results.
- Once the field is specified, we must tell it to add all the possible data values. In this case they are R or D.
- Once added, they are given default random colors, so click on each color block and change it to the appropriate color.
-
- Click OK when finished.
- When the data are compiled the way that will work, we switch to composing the map. Switch the main area of the ArcMap window from Data view to Layout view.
- Add a legend, keeping it as simple as possible.
- Since this map has a very obvious purpose and probably displays a very familiar area for your intended audience, such extras as a grid or north arrow or map scale are not important to communicating its information.
- A clear title, relevant to your audience, can be added to the map layout or can be saved in order to add it to a caption in the document where the map will be displayed.