Basic Operations in ArcGIS
ArcGIS Usage
The best way to appreciate how GIS software works is to actually use it.
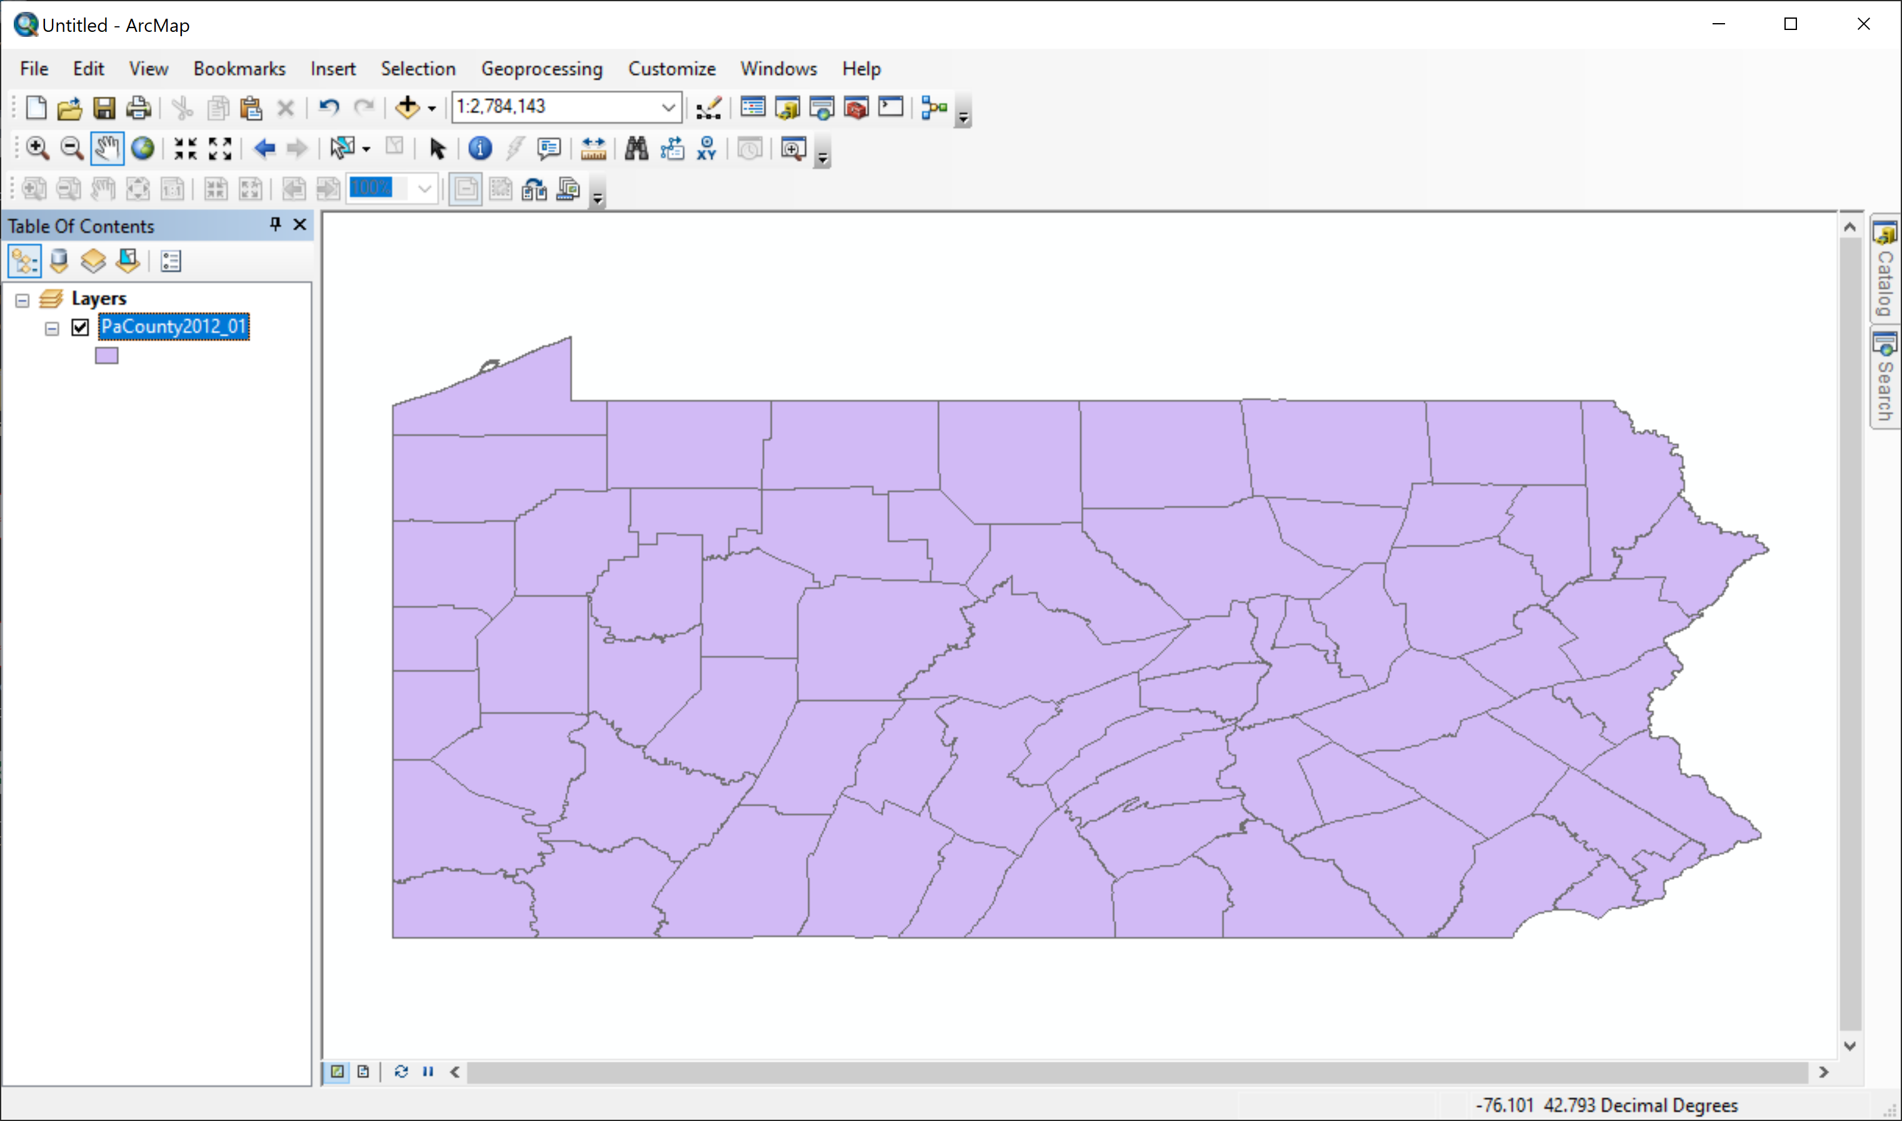
Recall the ArcGIS software window:
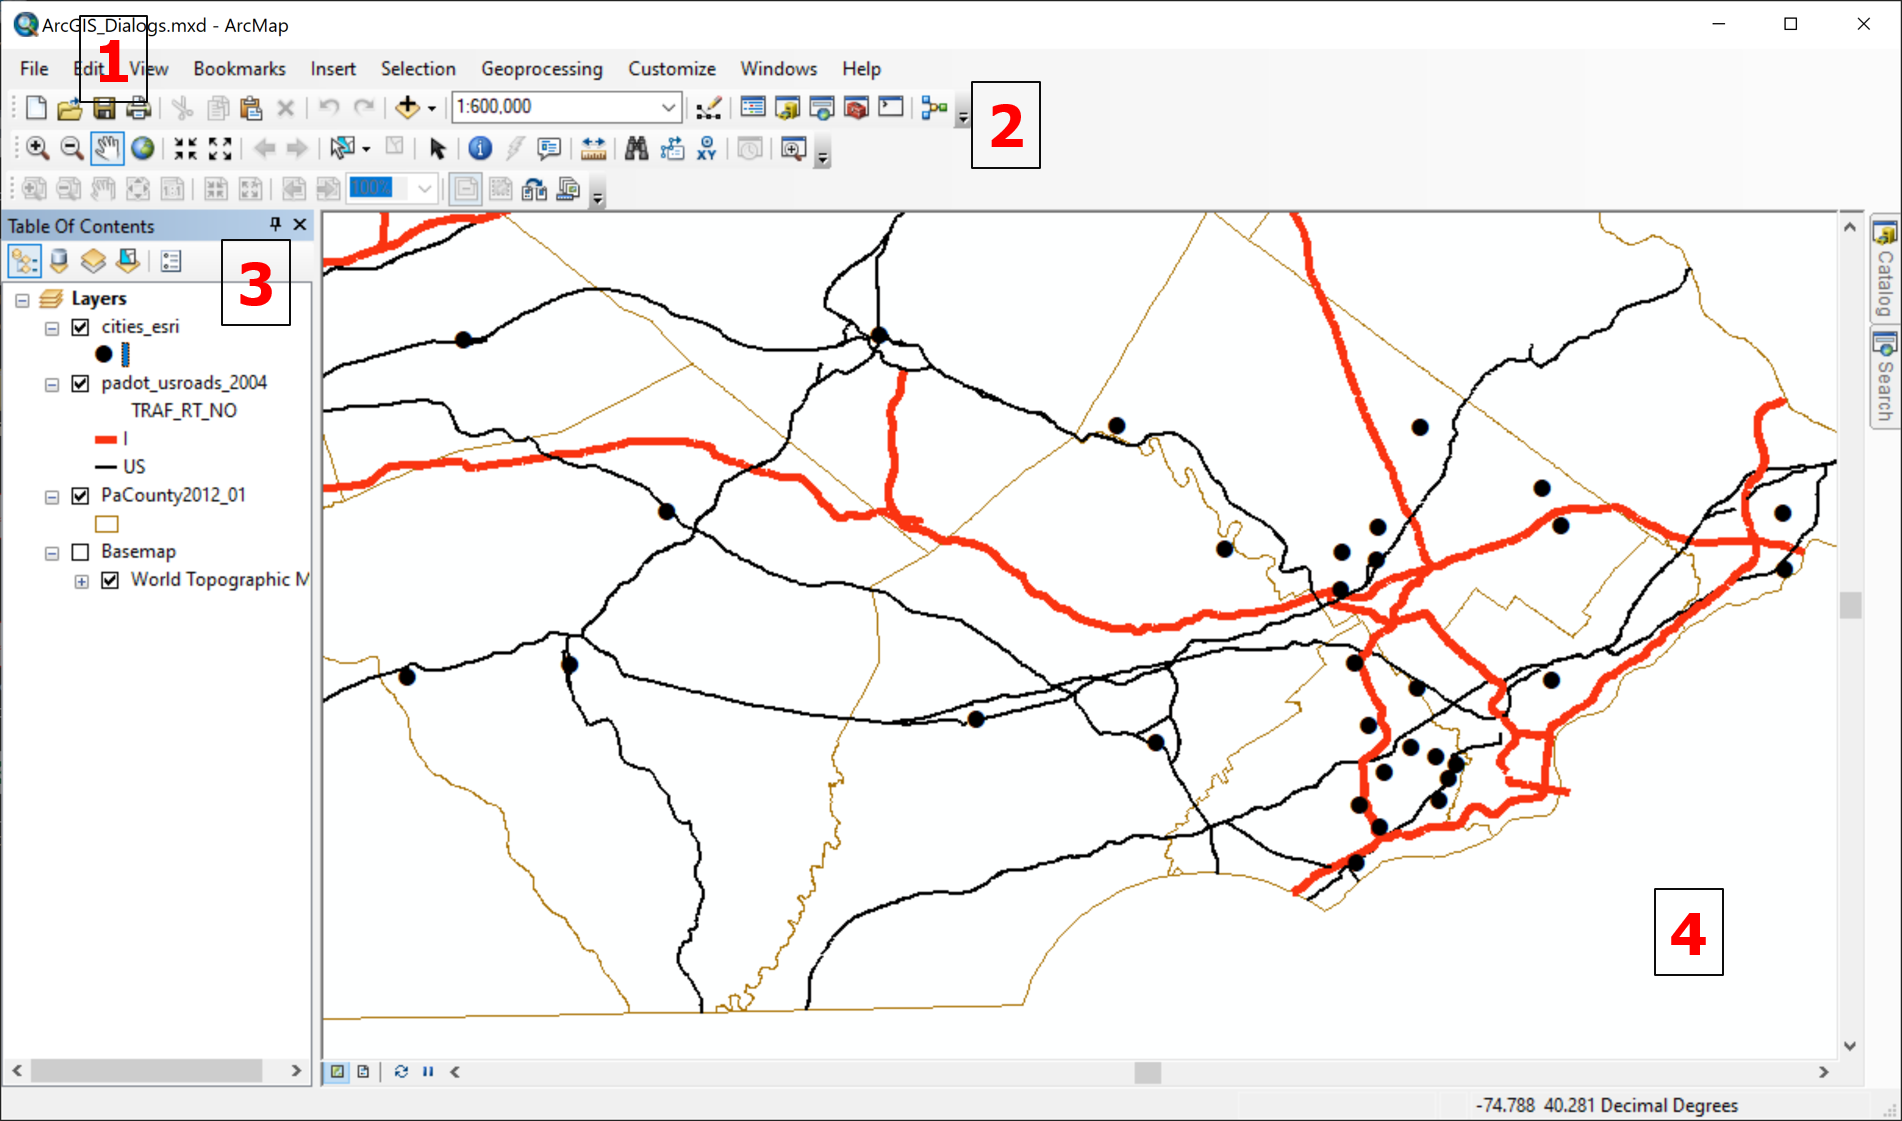
- Menus
- Toolbars
- Table of Contents
- Map
The Table of Contents includes the item that reads "Layers" under which is the list of all of the individual layers currently in the map. This Layers item can be right-clicked or double-clicked to perform tasks that affect the entire map. Each of the layer names can be clicked (to select it) or can also be double-clicked or right-clicked (both accomplish the same result) to perform tasks that affect that layer only.
The many menus and tools provide access to functional windows or dialog boxes that are commonly used in ArcGIS to accomplish other tasks. An example of an important task is the need to view attribute data associated with the features in a layer. One way is to select a tool enabling you to click on a feature to trigger a smaller popup window containing its data. Another is to open what is called the Attribute Table for an entire layer, which appears in a separate window that resembles a spreadsheet app.
General Workflow
Here is a general workflow to follow every time you start a new ArcGIS map project.
Keep in mind that the objective here is to give you the means to create your own GIS maps using relatively simple data and GIS software. Please try to stick to these instructions, at least initially, because other scenarios with more complex data sources and procedures are easily encountered.
Remember: In preparation for working in ArcGIS, it is good practice to have all your GIS-related data files in one folder, even if you create subfolders for individual projects or for some other organizational system. Doing so will greatly simplify your work experience with this complex software and enable you to focus on learning the program's operating procedures. If you will be using ArcGIS on the vLab client, you should set up your data storage on a "cloud" service such as OneDrive, Google Drive or Dropbox.
- First, open the ArcGIS app. It is slow to open, so be patient, especially if you have a less powerful computer or are using the vLab client. When the app is active you will initially be presented with the "ArcMap – Getting Started" dialog box.

The ArcMap Getting Started dialog box - If ArcGIS is installed on your computer, this dialog enables you to open a map document previously saved on your computer; if you are starting a new project, then just click on Cancel to close this dialog.
- If you are using the vLab client to access ArcGIS, it will not store previous work in what it identifies as “your” computer (even if stored on OneDrive), so this dialog will not be helpful. Just click on Cancel to close this dialog.
- The second step is to save your "map document." It is important to understand what the map document is and what it saves (and does not save). It is also important to re-save your work multiple times through a work session, not just because of the hazard of losing work if the program or computer crashes, but also because you may get to a point where you want to create two versions of the same map; saving the current version with a new filename can save a lot of work down the road.
- Third, you will need to "Add Data" to your map. "Data" in this context refers to the map layers that will make up your map. The first step in that dialog is to "Connect to Folder." After the folder is connected, the Add Data dialog box works like other Windows apps to open files. More detail is provided below.
- The fourth step is to organize your layers in the Table of Contents and symbolize each layer. Determining the order in which layers are drawn and symbolizing each layer help to determine what is visible and will control the overall appearance of your map. These controls will be described further in the next unit.
Caution: ArcGIS has many settings and many ways to customize the program; this presents a hazard at the introductory level, if the appearance of the window stops looking like examples in this (or any other) source. In those situations, be sure to exit the program without saving changes to your current document, in case those settings become a permanent part of that document.
Keep in mind that creating maps using GIS software is a bit like writing essays using word processing software (except for differences that will be pointed out below). Some tasks must be done every time you start a new project, and other tasks are repeated frequently during any work session. The more often you use the software and get comfortable with repeating those tasks, the more proficient and quicker you will become and the more new features you will be able to learn.
Finally, there are many Help resources available, both within the program and from the program's makers and fellow users online. You will need to learn "the language" of GIS to be able to query and communicate with those resources.
Save the Map Document
In GIS software a distinction is made between the individual data files that contain the map layers, and the map document file that stores information about how a particular map is compiled and composed. This is very different behavior from the way data files are accessed in other types of computer programs, such as word processor documents or spreadsheet files, which are not designed to share data, as GIS programs generally are. ArcGIS saves map documents as MXD files (e.g., PaTopoMap.mxd).
One way of seeing this distinction is to learn that saving a map document after you have added a set of layers and symbolized them a certain way does not alter the shapefile from which the data were added, so anyone else (or you, at a later time) can continue to use that shapefile; none of those other users will see your symbol choices. Your map document also does not save copies of each map layer, so if you give someone else a copy of your map document to open on their computer, they will not see any content. Your map document saves links to those shapefiles as they were stored on your computer, with your folder names and your folder arrangements. Someone opening it on any other computer with a different set of folder names in a different organization structure will not be able to re-establish those links. The map document also saves any symbology (and other) decisions you made. You can easily create many map documents using the same shapefile. There will only be one copy of that shapefile on your computer.
Another way of seeing this relationship between the GIS data files and the GIS map document files is to realize that GIS software also gives you the ability to edit the data files (which I do not recommend for beginners). These edits are not changes to the appearance of a layer (its symbology) but to its spatial features such as line lengths, point locations or boundary alignments. If you are working in your map and decide to edit one map layer, then those edits will appear in every map document that is sharing that layer. You can imagine that there are some benefits to having the software work this way, but there are also some potential problems it could cause.
To repeat, the map document or map file that you save only records the description of how that map is constructed, with links to the layer files, but does not store copies of those layer files. That is a major reason why a good practice, again especially for beginners, is to create a folder for each GIS project you work on. When you download and unzip data files (shapefiles), be sure to save them in that project's folder. When you save your map document, be sure to save that in the project folder also (it should have been the first thing saved in that folder).
Add the GIS Data
Of course, before we can add data using our software, we need to have the data. In order to accomplish that, you will need to locate sources of GIS data and copy the data to your computer. You should also learn to find data from other sources, which are plentiful on-line. The next couple of topics in this unit will explain those requirements in more detail.
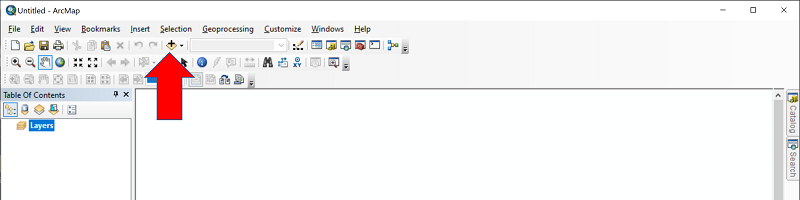
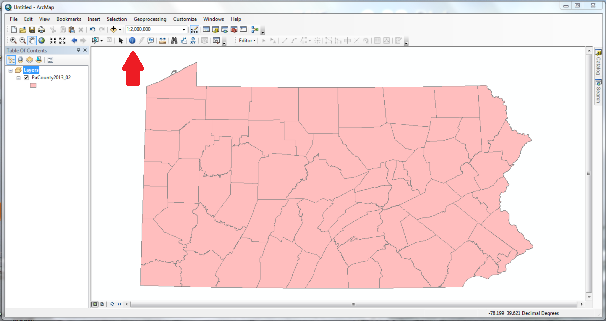
The second step in the workflow for using GIS software (above) was to add map layers. There are actually several ways to accomplish that, but the most obvious and straightforward process is to click on the appropriate tool, and then navigate to the data folder where you have stored your GIS data. In ArcMap this tool is known as the "Add Data" tool; it is important to note that it is not the conventional Windows "Open File" tool. ArcGIS places the icon for this tool, ![]() , in the toolbars below the menus at the top of the program window (see the image below). Again, be sure not to use the conventional Windows "Open File" tool (which looks like a partially open file folder) for this task.
, in the toolbars below the menus at the top of the program window (see the image below). Again, be sure not to use the conventional Windows "Open File" tool (which looks like a partially open file folder) for this task.
In ArcGIS the initial file browsing dialog box is the conventional type for Windows programs. However, before you can browse to the shapefile, you have to "Connect" to the folder that contains the shapefile. The tool icon for "connecting" is just above the file list in the file browsing dialog box.

Connecting to a folder works just like finding a file, but you have to remember to look for the folder, not a file. Folder connections are generally "remembered" by ArcMap.
- If ArcGIS is installed on your computer, this step means that the next time you start ArcGIS it will retain any folder connections you have made. If you stay organized and keep all GIS data in one folder (even if you create subfolders for individual projects or for some other organizational system), you will seldom have to "Connect to Folder" again. Then, add your data. This is also a good time to save your map document, and to remember to re-save the map document frequently during your work session.
- If you are using the vLab client, folder connections will not be retained from one session to the next, so you will have to create the folder connections every time you start. To make this process more straightforward, it is recommended that you store your GIS data and map documents in one older in your OneDrive storage space, download that folder to the virtual Desktop within the vLab client, and work with all folder connections pointing to that Desktop. Within this work session you will probably not have to "Connect to Folder" again. Then, add your data. This is also a good time to save your map document, and to remember to re-save the map document frequently during your work session.
After you connect to the folder, the Add Data dialog box will diplay the shapefiles that are stored in the folder; keep in mind the earlier discussion that said that you will not see all of the individual files that make up the shapefile, just the one that ends in ".shp." If there are multiple files to add, select them individually using the "Ctrl" key on your keyboard or, if they are consecutive files, hold down the "Shift" key while selecting the first and last in that group.
Once you click on the "Add" button at the bottom of the dialog box, any data you selected will be added to the map in the main part of the ArcMap window.
Adding More Layers
The first time through this process, I recommend adding one points layer, one lines layer and one areas layer. The advantage of this approach is that you will most easily be able to rearrange the layers so that all three are visible. Having one of each kind of layer will provide the opportunity to practice applying all three types of symbology in the next unit.
Symbolize Each Layer
Two primary factors affect the visual appearance of each map layer. The first is where it occurs in the "drawing order." The second is how the features in that layer are symbolized. Symbolizing each layer is an important part of the map compilation process because it forces you to think through the contribution that each layer will make to your finished map. These ideas will be explored in the next unit of this text.
Navigate the Map
Zooming In and Out
GIS programs, like the on-line map services you looked at earlier in the course, have to allow users to zoom in and out of a scene. This is a process of changing the scale of the map. As a standard feature in all GIS programs, it can be performed using a variety of tools, menus and other points of control.
The primary method used to change the map scale in GIS software is by use of Zoom tools. In ArcGIS there are two Zoom tools, Zoom In and Zoom Out:  .
.
Note how clicking on either Zoom tool changes the appearance of the cursor. The Zoom tools work in two complementary ways. One way is to click (single-click) with the tool anywhere in the map portion of the program window. The map zooms by a small amount and is re-centered on the point where you clicked. The second way is that you can click-drag-and-release to create a zoom rectangle.
In ArcGIS, clicking and dragging with the "Zoom In" tool enlarges the map scale to fit the rectangle area to the window: the smaller the rectangle, the greater the scale increase. Doing so with ArcGIS's "Zoom Out" tool is a little more quirky: the smaller the rectangle, the greater the scale decrease (that is, the farther it zooms out), and the larger the rectangle, the less different is the zoomed-out map scale.
There are other ways to zoom in and out in ArcGIS:
- The Zoom tool is usually the preferred way to control both the scale of the map and where it is centered.
- Also, the program allows you to type a new scale denominator in their representative fraction scale adjacent to the map window (we will learn more about representative fraction scales later in the course).
- ArcGIS includes a third toolbar button shaped like the Earth; it is called the "Full Extent" tool. Clicking on it simply zooms the map out to fit the entire extent of the map data into the map window.
- Unlike Google Maps and similar websites, which place zoom in and zoom out icons right on the map, ArcGIS does not do that, but it does have similar tools in the toolbars above the map.
- ArcGIS also includes a feature in their Layers list/Table of Contents that allows you to select a layer, right click on the layer name, and choose a "Zoom to Layer" command. ArcGIS will zoom out to the full extent of the layer you have selected
- Finally, ArcGIS allows you to use a mouse's scroll wheel to zoom, although the direction you scroll that wheel in order to zoom in is not consistent with its use in Google Maps and similar web sites. Sorry, you will just have to get used to that inconsistency.
- Zoom In and Out tools
- Typable map scale
- Zoom to Full Extent button
- Zoom In and Out buttons
- Zoom to Layer (on the current layer's right-click menu)
- (mouse feature)
Panning
The term "panning" comes from photography and movie making, and means to move the camera left or right, up or down, to see a different part of the scene. Panning in GIS simply means sliding the map in any direction to see a different part of the map area.
In most on-line interactive maps such a process works intuitively: click and drag the mouse to move the map. In ArcGIS, it is not that simple. You must first select the "pan" tool  in order to do that.
Shapefiles
The Shapefile Format
The most common format for exchanging GIS data is the "shapefile" format. It was originated by Esri with the product that was their predecesor to ArcGIS, and there is another format taking its place within the ArcGIS world, but the shapefile is still a common data standard. When you are searching for data, and come across sources in multiple formats, the shapefile is the easiest to manage. That is not to say that the shapefile is perfect, but it is certainly less prone to problems than other formats. Here are a few points to remember with regards to shapefiles:
- Usually when you download data in the shapefile format, you will actually download a ZIP file, e.g., "USstates.zip." Make sure that you unzip or extract the ZIP file, as explained below.
- In the Add Data process described above, the file browsing window in ArcGIS does not show you all of the individual files that make up each shapefile GIS layer. It will also not display any non-GIS files in those data folders, as if they do not exist (but of course they will be visible in your computer's own file browsing program).
- Again, it will be most efficient if you set up a folder on your computer for all of your GIS data files (shapefiles). If you hope to go beyond the basics I am showing you here, it will be best to create subfolders of that folder to keep your data organized.
The shapefile format can hold all three of the basic types of GIS features. This flexibility is its primary asset. There are many additional GIS data types (beyond the scope of this course), but they all start from these basic types.
Processing ZIP Files
A zip file is either a file or a collection of files (a folder) that has been saved in a way that compresses its contents into less computer memory. The usual reasons for creating zip files have to do with transferring the embedded files from one computer or user to another. A file that takes less computer memory will load faster in e-mails and other data transfers.
As mentioned above, a ZIP file is a way to compress the file to a smaller size. Your computer's operating system gives you the ability to "unzip" or "extract" such a file. There are also several programs free to download that will perform that function.
You can recognize zip files by their filename and/or by their icon in your file explorer software. When a zip file is created, a ".zip" extension is added to its filename. Unfortunately, in the Windows file explorer programs it is possible that the default setting is for filename extensions to be hidden. In the file explorer program, the icon for file folders is a small image of a manila folder, while the icon for a zip file is a manila folder with a vertical zipper on it. It is probably similar on Macs, although I have no experience with them.
Note that the file explorer software (called File Explorer) that comes with Windows 10 allows you to double click on a zip file and see its file contents; this does not unzip the files for further use. This is different from the behavior that occurs on Mac computers (see below).
How to Unzip
- On a Windows PC: Right click on the zip file (its name or icon) in File Explorer. One of the choices near the top of the menu that opens is to “Extract all.” When you select that operation a second dialog box will appear asking for location, with a default location being a newly created subfolder with the same name as the zip file. You will be able to move the folder later, but the important thing is to make a note of it now so that you can find it.
- On a Mac computer: Simply double click on the zip file in the file explorer program. This will “expand” the file into the original file or folder.
When you have unzipped a zipped shapefile, and look at the results in your file explorer software, you will see that the shapefile is not actually one file, but a group of files with the same filename and different filename extensions. For example, if you unzip "USstates.zip" you will find USstates.shp, USstates.shx, USstates.dbf and probably several others (those three extensions are the minimum needed). Always make sure they are moved and stored together in the same computer folder. You can store as many shapefiles stored in the same folder as you like, but all the files that arrive together in that ZIP file must stay together.
Note: Make sure that you do unzip or extract the ZIP file. Your computer's built-in file browser will allow you to view the files "inside" the ZIP file without unzipping them. You must realize that the GIS software cannot access their contents until they are actually unzipped.
Accessing Attribute Data
Features and Attribute Data
Making geographical (or geospatial) decisions requires the ability to create multi-layered maps, as well as the examination of information associated with the features of each map layer. In fact, this is getting at the reason why they are called "data themes" rather than just layers. Information in the form of data is really the heart of what GIS is all about. For each data theme, the software uses both the coordinate data to draw the map, and also attribute data about that theme's features. The GIS attribute data are stored in a table structure; each row of the attribute table for that data theme is linked to one feature in that data theme. Each column in that attribute table contains a different kind of information for those map features. For example, a data theme representing all of the residential buildings in a community is linked to a table of information about those buildings, each building linked with its own row in the table. The table can have one column recording the building addresses, another storing owners' names, a third with the number of stories in each building, a fourth with the number of square feet of floor space, etc.
Attribute data tables are integral to the functioning of GIS software, including ArcGIS. Every vector map layer (showing points, lines or areas) will include data stored about the visual map features. Some of that information can be used in spatial analyses, though that aspect is beyond the scope of this course. Some of that attribute data can be used to symbolize the layer it is attached to, which is also extremely valuable. When you acquire GIS data (see below), one of the ways to assess its quality is to examine its attribute data.
Try it:
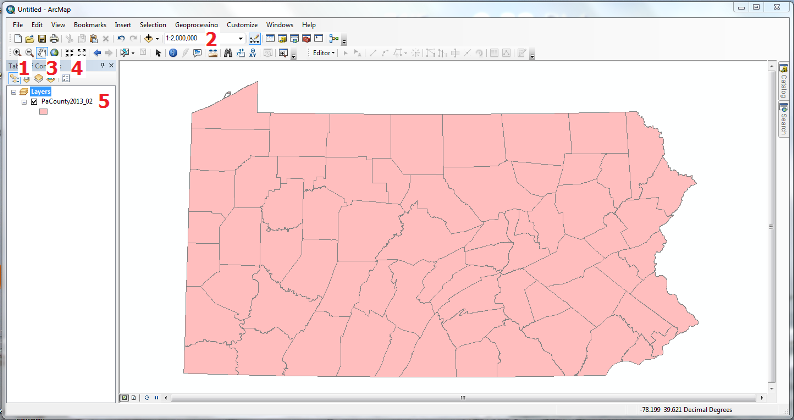
To open the attribute table for any layer, click on the layer name in the map’s Table of Contents to select that layer. Then, right click on that layer name to open its layer menu. One of the top choices on that layer menu is “Open Attribute Table.” See the illustration below.
The table opens in its own separate, floating window (below), though it can be “anchored” inside of ArcGIS’s main window. It is a simple table of rows and columns, much like a spreadsheet app such as Excel, with a few differences. One major difference is that every column has a heading, or name. Some data tables that you can download and open in Excel will use the top wo or three rows to describe the contents of each column. That will not work in ArcGIS; whoever creates the data table has to find succinct ways to name columns that still reflect the column’s contents. You will also notice that the row of column names is not assigned a number, as it is in Excel. In fact the columns in the Attribute Table are not even referred to as “columns” or even as “variables.” Instead, they are called “fields.” For use in ArcGIS, the first couple of fields in a vector layer’s Attribute Table will always include “FID” (whch stands for Feature Identification) and “Shape” which will (rather repetitiously) show what kind of layer you are examining.

Data Access
GIS users have several additional ways of accessing a layer's attribute data. Another simple approach allows the user to click on one feature to bring up a list of its attributes from the table. A standard feature in all GIS programs, in ArcGIS it is performed using the "Identify" tool.
Note that in the attribute table, that feature's data would be stored in one row, with one data value in each column of the table. In the pop-up window that appears when you click on the feature with the Identify tool, however, its information listing will show up in list form (vertically), each item in the list corresponding to the data table values in that feature's row.
The images below demonstrate the steps to query a data theme. The Identify tool is in the row of tools above the program window. ![]()
Try it:
- Click on the Identify tool icon in the toolbars above the map portion of the program window. When you move the cursor to the map, the cursor will change.
- Click on one of the map's features.
- A new window appears displaying attribute data for the feature ArcGIS finds closest to the point you clicked.
- The trickiest aspect of using the ArcGIS Identify tool is when you have added several data themes to a map. It is not always obvious which layer's data will be listed. ArcGIS does provide a way to choose the desired layer right from the information window.
Feature Selection in GIS
The linkage between feature locations and feature attribute data are GIS's defining characteristic. Once you can see the data connected to each feature on the map you have a powerful way to store information and to access it.
We can go beyond looking up feature data, though. Another typical function of GIS software is to select a map feature. Selecting a feature establishes a temporary hold on that feature. It is a familiar concept to computer users; we have selected map layers in our GIS program, selected text in a word processing program, and selected cells in a spreadsheet program. Once the selection is made, a great variety of built in or custom tools allow many different types of analytical operations on the selection; we will focus on one of those operations.
Feature Selection from the Map
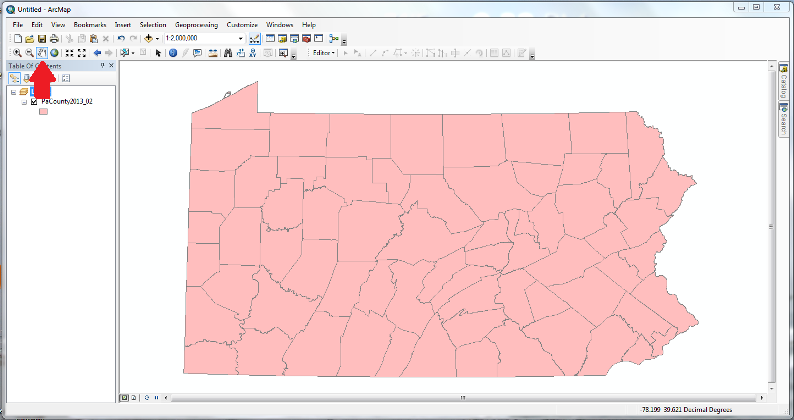
Here you will see how the selection procedure works in ArcGIS. You will see this carried out in a few different ways over the next few pages. In the first approach, you will select a feature in a layer from the map using a tool. Look for the Select Features tool in the toolbars just above the map. The Select Features tool looks like: ![]()
- Click on the Select Features tool. The cursor changes appearance when you move it over the map.
- Select one of the layers in the Table of Contents by clicking on it.
- Move back to the Map and click on one of the features in that layer. Notice that the feature gets highlighted in a different color than the rest of the features in that layer.
- Open the Attribute Table for the selected layer and the feature's row in the data table is given a color highlight (you may have to scroll down to find it).
Feature Selection from the Attribute Table
In another approach we select the feature from the layer's data table.
One way to think about this is to compare it with working in an Excel spreadsheet: clicking at the very beginning of a row selects that row. Keep in mind that selecting columns or individual cells will not accomplish anything in GIS.
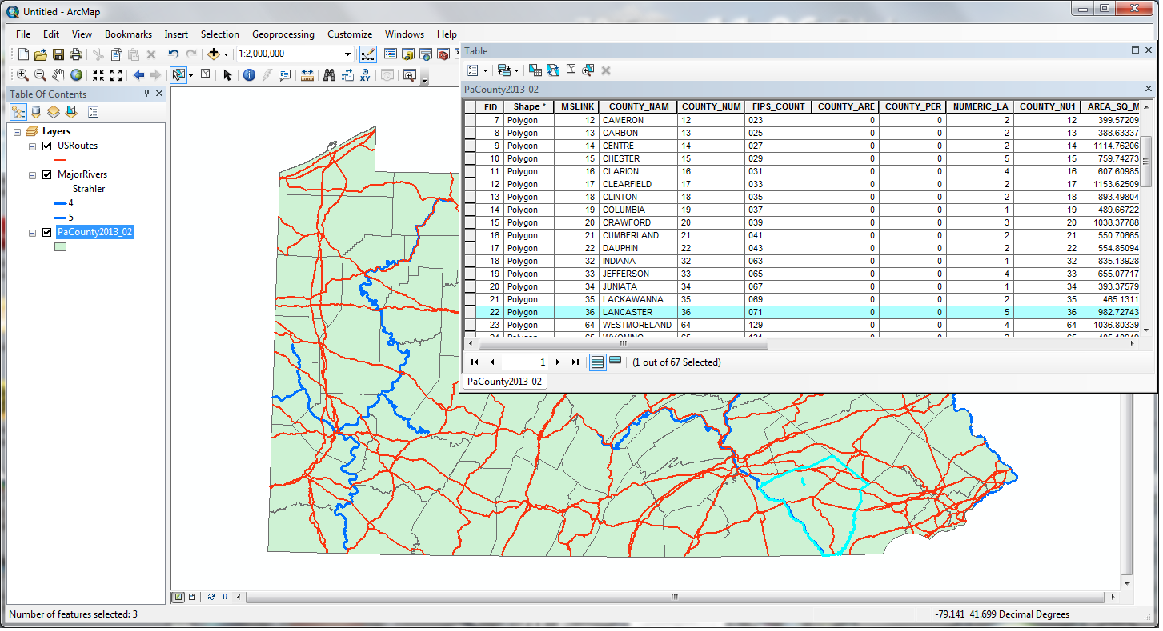
This version of the selection procedure is illustrated below.
- Select one of the layers in the Table of Contents by clicking on it. Then right-click on it and choose "Open Attribute Table" (which appears in a separate window).
- Scroll down to find the desired feature, and click on the left-most end of it to select it; its row in the attribute table is given a color highlight.
- Move back to the Map window and notice that the feature has been highlighted in a different color than the rest of the features in that layer.
Multiple Feature Selection from the Map
On the previous page, we compared selecting map features to selecting word processor text and spreadsheet cells. Like those other programs, selecting multiple features in the map view of ArcGIS can be done by using the Select Feature tool while holding down either the Shift or Ctrl key on your keyboard.
Another version of this procedure, working within the map, is to use the Select Feature tool to create a rectangle (clicking on one corner and dragging to the opposite corner before releasing) that includes a desired set of features. Note that for an areas layer, the process selects every area touched by the rectangle, not just those inside the rectangle. All of the selected features will be highlighted on the map, and all of their rows of data will be highlighted in the attribute/data table.
Again, this version of the ArcGIS selection procedure is illustrated below.
- Look for the same Select Feature tool you used before in the toolbar above the map and click on it. The curson changes appearance when you move it over the map.
- Select one of the layers in the Table of Contents by clicking on it.
- Move back to the Map and click on one of the features in that layer. Notice that the feature gets highlighted in a different color than the rest of the features in that layer.
- Hold the Shift key down and select another feature in that layer. Now both features should be highlighted.
- Open the Attribute Table for the selected layer (which appears in a separate window), and the selected features' rows in the data table are given a color highlight (you may have to scroll down to find them).
- Another way to use this tool is to "click and drag" a box shape on the map. Every feature of the selected layer that is in or touching that box will be selected, and all of their rows in the data table will be highlighted.
Multiple Feature Selection from the Data/Attribute Table
Just as we did with selecting a single feature, we can also select multiple features from the data table.
Once again, compare it with working in an Excel spreadsheet. As in Excel, you can select multiple rows by holding down the shift key if they are consecutive, or the Ctrl key if they are scattered throughout the list. To make one type of analysis easier it is also commonly easy to rearrange the rows of the attribute table by sorting them according to one of the columns of data.
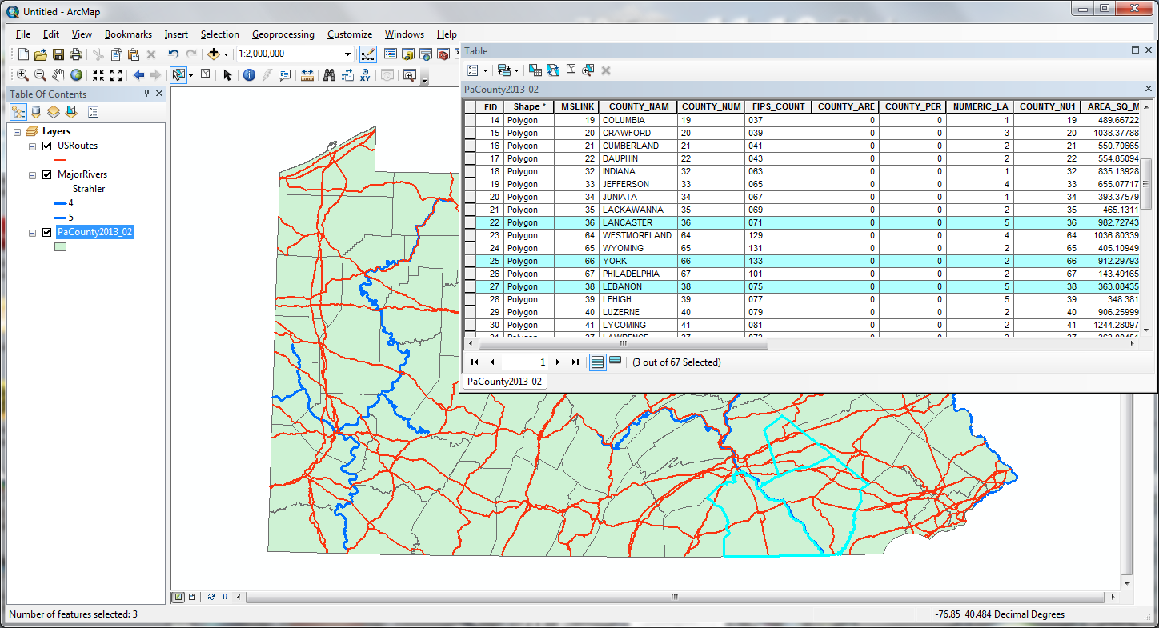
Again, this version of the ArcGIS selection procedure is illustrated below.
- Select one of the layers in the Table of Contents by clicking on it.
- Open the attribute table for that map layer (in a new window) and click on one of the rows in the table. Notice that the row and the corresponding map feature are highlighted.
- Hold the Ctrl key or the Shift key down and select another row in the attribute table. Additional features in that layer will be highlighted in both the table and the map.
The Purpose behind Selections
Many types of GIS analysis start with, or involve at some point, selecting subsets of the features in one or more layers. Much analysis is a process of eliminating candidate sites or other features.
Other Kinds of Selections
The importance of the selection process is underscored by the fact that there is another set of ways to select features. We will not have you try it here in this course, but you can be sure to learn it in any GIS course. The approach is called spatial selections and they generally involve two or more different map layers.
One example can occur when you have a layer of point locations and a layer of areas. The types of selection we have talked about here can be used to create a subset of the areas, and the spatial selection process can be used to select all of the points within the selected areas. Now the relationship between two different layers becomes part of the analysis strategy.
There are many different types of spatial selection procedures, partly because there are many different combinations of the three types of geographic features, but also because GIS developers have articulated many different types of spatial relationships.