ArcGIS Coordinate Systems
Unprojected Maps
There is an insidious disease which has infected the Internet. It is caused by uneducated or lazy map makers (they cannot be called cartographers). It is . . . the Unprojected Map!
Unprojected maps are maps in which the non-Euclidean Earth coordinates, recorded in degrees, minutes and seconds or decimal degrees, are used without mathematical conversion as coordinates on a flat plane in which one degree of latitude is the same length as one degree of longitude. Technically, there is a map projection called the Plate Carrée projection which has the characteristics and appearance of the unprojected map, but the Plate Carrée projection has very specific preferred applications, such as when depicting a very small urban area or a relatively small area along the equator. It is clear that most unprojected maps are not intentionally emulating those properties.
Three examples of unprojected maps are presented here. It is not necessarily easy to tell whether a map is unprojected or not, but it will be easy if the map covers a well-known area that you are used to seeing on globes or on projected maps.
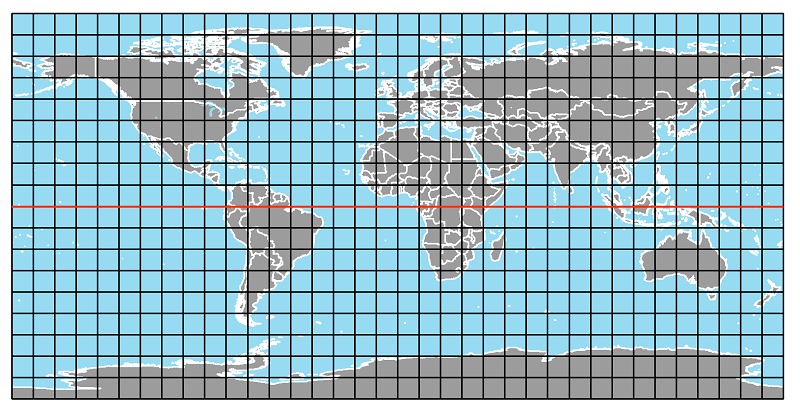
The Unprojected World Map:
There are cylindrical projections, as you will see, which come close to the distortion visible here. The key difference, though, is that the distortion on projected maps either serves a purpose itself, or is unavoidable because of another Earth/globe property that must be preserved. The unprojected world map has no redeeming property or purpose.
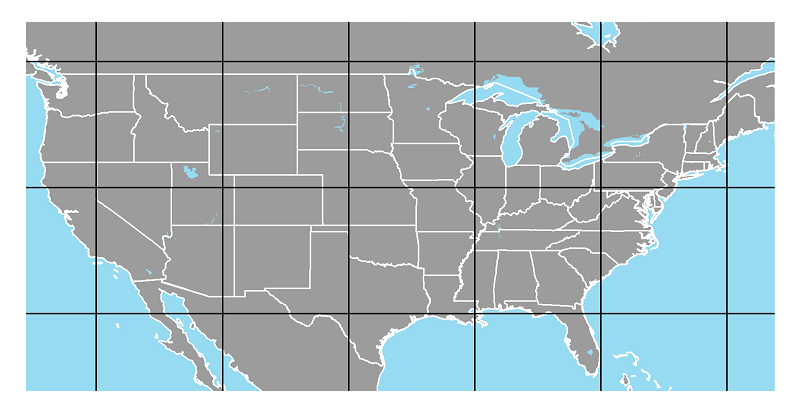
The Unprojected US Map:
These unprojected maps really stand out because virtually every map showing the entire US is in the family of Conic projections. The stretched-out (east-to-west) appearance and the straightened boundary with Canada are the most obvious clues.
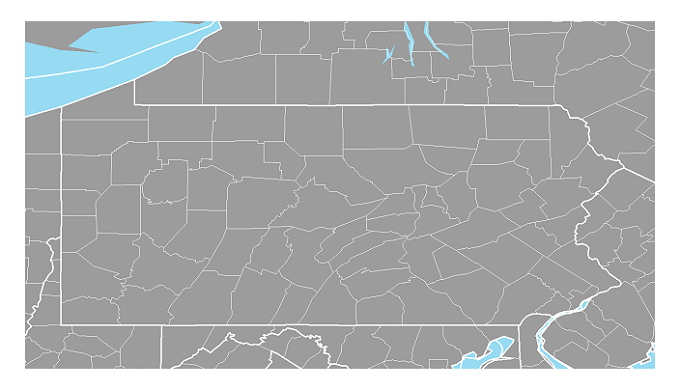
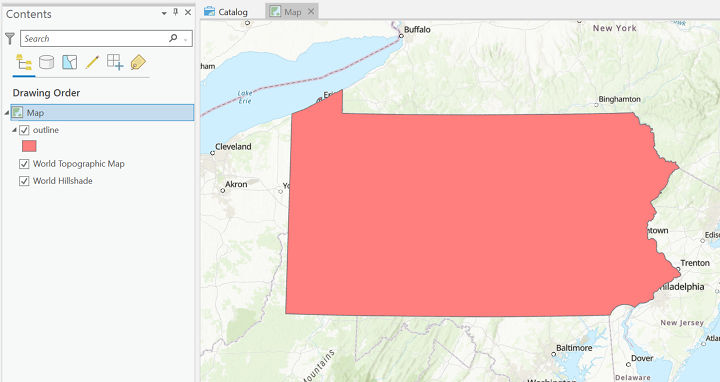
The Unprojected Pennsylvania Map:
Maps showing the entire state of Pennsylvania are usually projected on a Conic projection grid also. It is difficult to pinpoint any particular shape changes to the state boundary, but once again the stretched-out appearance is the best clue.
GIS Data Coordinates
There is a difference between the coordinates in which a GIS layer is stored and the coordinates in which that layer is displayed. The former are called the data coordinates or "geographic coordinates" and the latter are called the "projected coordinates." One of the computer files that makes up a shapefile (the one ending in .SHP) is the data file containing the coordinates of each point that either makes up a point feature itself or serves as a pivot point along a line feature or along the outline of an area feature. Those "geographic" coordinates must be recorded in some units of measure, and those units of measure depend on how the layer was created. If the layer originated from actual locations on the Earth's surface, the geographic coordinates will likely be decimal degrees. If they originated (for the project at hand) from a projected map, the geographic coordinates will likely be in feet (for a map with a state plane projection) or meters (for a map with a UTM projection).
Those geographic coordinates must be translated to positions on your computer screen (or on a sheet of paper), which has its own plane geometry coordinate system with different units of measure. But before those map features get to the computer screen or paper, they are calculated to fit a generic flat surface. Those generic coordinates are the "projected coordinates." The projected coordinates are based on a standard map projection which you, as the cartographer, choose (see below) applied to control the distortion caused by representing the round Earth on a flat surface. From those projected coordinates, the screen's (or paper's) physical coordinates are easily calculated. The projected coordinates also make it easy to add layers of features whose locations are calculated, such as a grid layer for the Public Land Survey System.
The primary reason why the UTM and State Plane coordinate systems exist is to make the projection process easier. Since the geographic coordinates are already projected, as long as the desired map projection is the same coordinate system, the projection process becomes simple for the cartographer and for the computer. Projecting a US state map (or a map of part of a state) using a conic projection and then drawing a grid on it with a starting point (0,0) from which every location on the map could be measured in feet would result in the State Plane Coordinate System for that state (or that part of the state). Similarly, the geographic coordinates for the UTM coordinate system are stored in metric units, based on an original projection process that displayed the map area using Mercator's projection laid "transversely" (from pole to pole).
ArcGIS Pro can also handle the more complicated situation in which a layer whose geographic coordinates are UTM coordinates is to be reprojected to a State Plane projection. It can also handle the situation in which each layer on a map with multiple layers comes to the project in different geographic coordinates.
Projections in GIS
Projections in Google Maps
The geographers who helped Google get Google Maps started had to decide on a map projection for displaying their maps. The biggest challenge was that it had to look reasonable whether the user was zoomed in to a small local area or zoomed all the way out to look at the whole country or world. As a matter of fact, if you look closely as you zoom in or out in Google Maps from any starting point, there is a small range of zooming in which the map is getting bigger or smaller, but if you zoom to an extent beyond that small range you are actually looking at a new map. To make that process look as seamless as possible, Google adopted one map projection for all their maps. It is actually a modified Mercator projection called the "Web Mercator Auxiliary" projection. When Esri started producing their own online map display tools, they followed Google's lead and use that same projection. The only exception is that when you zoom out far enough that the Mercator projection's limitations in polar regions become obvious it will switch to a planar projection, one that can be manipulated like a spinning globe.
GIS software uses map projections in two ways:
- Control the map grid in order to portray the round earth on a flat surface (paper or computer screen).
- Combine on one map a layer stored in one coordinate system with a different layer stored in another coordinate system (not all GIS programs can handle this scenario).
- The program determines from the geographic coordinate system of the first layer added the default map projection (or projected coordinate system) with which to display the map.
The map projection function of GIS software is really just the application of a mathematical equation, but it is one that the software is repeating for every feature in every layer every time the map is zoomed or panned.
To the above ways GIS software uses map projections we can add a third.
In ArcGIS Pro, before you add a layer, the default basemap is always projected to the Web Mercator Auxiliary projected coordinate system. Then the geographic coordinates of the first layer added to the map determine whether it needs to re-project the map. If its geographic coordinates were already projected to the Web Mercator projection, the map projection will not change. Any subsequent layers added are projected (if necessary) to the same projected coordinate system. If that first layer's geographic coordinates are in any other coordinate system, then that becomes the map's new projection and subsequent layers are projected (if necessary) to that coordinate system.
For example, if the geographic coordinates of that first layer are decimal degrees, the result will be an unprojected map (see above), and it will look very distorted. If a second map layer with state plane feet for its geographic coordinates is added, ArcGIS Pro converts its geographic coordinates to that first layer's unprojected coordinate system.
However, you can override that default map projection or that first layer's coordinate system and decide on a different one. The instructions for doing so are presented below. Again, a map whose layers lead to an unprojected map must be projected to one of the standard map projections described in the previous Unit with several exceptions. Mercator's original projection was devised for ship navigation, a purpose that is no longer the challenge that it used to be. It is not ideal for any other map presentation. The Web Mercator Auxiliary projection is functional for web maps that will be zoomed and panned interactively, but it too is not an attractive or effective projection for any presentation purpose.
One other situation merits discussion. If the map area is relatively small and right on the equator, where one degree of latitude is the same distance as one degree of longitude, any rectangular cylindrical projection centered on that meridian will generally be fine. You could even choose a latitude-longitude-based geographic coordinate system (yes, an unprojected one) to be the projected coordinate system.
Projections in ArcGIS
Projecting Maps
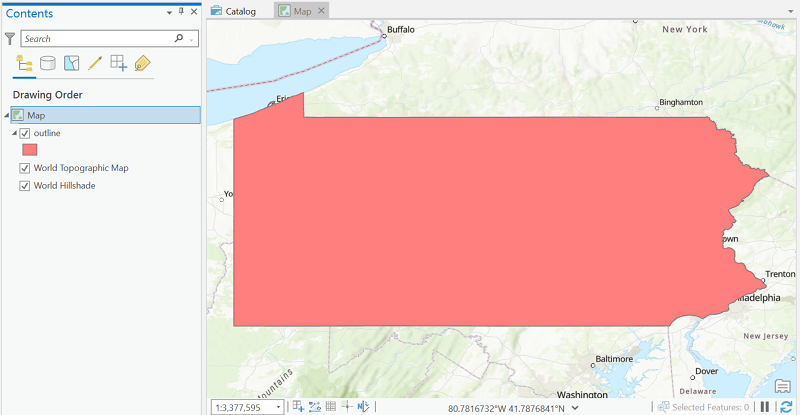
Let's follow an example in which you want to project the unprojected map of Pennsylvania below. In order to apply a map projection to an unprojected map, or to a map whose initial or current projection is different than what you want, here are the steps.
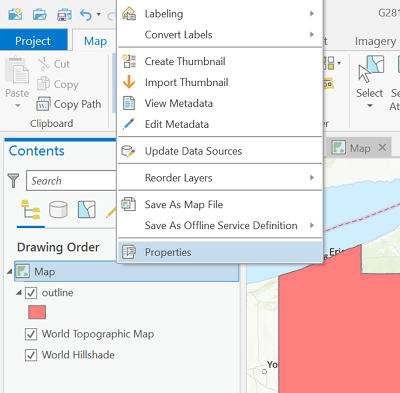
- Right-click on the word "Map" at the top of the Contents area of the ArcGIS Pro window.
- Select "Properties" at the bottom of the menu that opens.
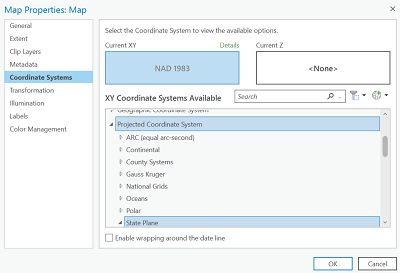
- Select the "Coordinate System" link in the "Map Properties" dialog box that opens.
- The right side of the dialog box shows four expandable lists: "Favorites," "Layers," and then "Geographic Coordinate System" and "Projected Coordinate System." Each list expands to several categories, each of which expands to many subcategories, each of which contains many named map projections. At the highest level select the "Projected Coordinate System" list.
- For the Pennsylvania map, first select the "State Plane" category, and within that select the "NAD 1983 (2011) (US Feet)" subcategory.
- Within that subcategory, select the specific projection named "NAD 1983 (2011) StatePlane Pennsylvania South FIPS3702 (US Feet)." Then click the "OK" button.
Additional Ideas about the Coordinate Systems Dialog
In order to grasp how map projections are used in ArcGIS, notice that they are not referred to as "map projections," but as "projected coordinate systems." As described earlier, the process begins with knowing the geographic coordinates of the first map layer added to the current map which determines the initial projection (or lack of projection) of the map.
To project the map, we convert the default or initial "geographic" coordinate system to a "projected" coordinate system. The conversion process works because ArcGIS Pro contains all the possible mathematical formulas needed to make these conversions.
It would be nice for our purposes if the categories of Projected Coordinate Systems had names like Planar, Conic and Cylindrical, but they don't. In ArcGIS Pro the primary criteria have to do with where in the world the map area is. Those options are the names of their main subcategories: Continental, State Plane, World, etc. The subcategory names they chose do distribute the individual projections relatively evenly, so each category has many named projections. Their category names were probably also chosen because they are meaningful even for users who have not had a course taught by geographers or cartographers, like this one.
There are literally hundreds of choices of projected coordinate systems in ArcGIS Pro.
The Finished Map
Once the map is projected, the remaining tasks, Composition and Publication, are aimed at completing the map. Depending on the purpose of the map, information can be represented in a number of ways. We learned some of the ideas of topographic map symbology earlier in the course, and will learn about the types of thematic maps later in the course.
For now, adding other map layers can enhance the effectiveness of the map. For the projected map below, a good next step would be to add highways and rivers. When they are added, because the map window has already been projected, they will be projected, too.
Choosing an Appropriate Projection
Appropriate Map Projection Choices
The best map projection choice will always depend very much on the map's purpose and spatial context. The list below should be considered to be illustrative, and not comprehensive. There are literally hundreds of different map projections that have been developed since the original Mercator Projection; most are easily enough programmed. However, the number of different projections you will ever use is probably very small, probably fewer than a dozen.
ArcGIS offers abundant choices in its organizational structures. As you saw on the previous page, the map projection is chosen from a menu of many projections, which are divided them into several levels of categories. Even for basic needs, such as World maps, US maps or Pennsylvania maps, the number of choices can be intimidating. You will also notice that, in addition to the projection name, a 4-5 digit identification number is given, which is part of an internationally-recognized system. If you visit multiple projection categories in ArcGIS, you will see that many map projections are designed for very specific areas of the world or US.
Consider that in most job situations your company or organization or agency will probably have a certain region or territory of operation. The maps you might produce for their work will generally focus on that area. It is not very likely that you will produce world maps and US maps and state maps and local maps. The list below has been kept simple for that reason. If your scope of work focuses on one of those areas, you may well have to go beyond this list within that area.
| Area | Purpose: Sizes of areas is primary. "Equal-Area" | Purpose: Shapes of areas is primary. "Conformal" |
|---|---|---|
| World | Most are non-rectangular cylindrical projections. Mollweide, Sinusoidal and several Eckert projections are classics; the Robinson and Winkel-Tripel compromise projections are also very effective. | Mercator is the classic but significantly distorts polar areas, so it should be avoided. Many other rectangular projections are conformal. For non-rectangular projections, Robinson and Winkel-Tripel are effective compromise projections. |
| USA | Albers equal area conic projection. | Lambert conformal conic projection. |
| Pennsylvania | Albers equal area conic projection. | Lambert conformal conic projection. This is the basis for the Pennsylvania State Plane coordinate system. |