Multiple Norths
What Direction is North?
The essential function of topographic maps is that they can be used to describe a landscape, including being able to report the direction of one landscape/map element (for example, one road intersection) relative to another. But direction is one of the more slippery concepts because there are multiple bases for measuring and reporting it.
You may already know about the difference between true north and magnetic north. A third "north" is shown on many (but not all) USGS topographic quadrangles; it is known as grid north and will be described below.
True North
True North is the direction from any place on Earth to the north pole, where all of the graticule's meridians converge. There are, technically, an infinite number of meridians. However, from any location there is always one direction to refer to as True North. Any two positions on the same (precise) meridian will share the same True North direction. Conversely, any two positions on different (precise) meridians, no matter how far apart or close together, will have different True North directions.
Magnetic North
Magnetic north (described next) is the north to which all magnetic compasses point. Magnetic North exists because the Earth contains tremendous amounts of iron and other minerals with magnetic properties; in short the Earth is one giant magnet. Like any smaller magnet it has two opposing poles. Also like any smaller magnet, the Earth-magnet has the property that opposite poles attract, and identical poles repel. That is why a magnetic compass works: the north "pole" of the magnetized compass needle is attracted to the Earth's magnetic south pole. Ironically (no pun intended), the Earth's magnetic south pole is located near its geographic North pole (Kyoto University).
Where is the Earth's Magnetic North Pole? Again, this is a tricky question because the magnetic north pole is continuously moving, generally by small amounts over the course of a year. In the last decade it was located in the northern Arctic Ocean, in the northern waters of Canada, as shown in the map below. According to Canadian geologists, who occasionally send survey teams to pinpoint its latitude-longitude location, it was recently positioned at 84.9° N and 131.0° W, and is moving toward the west (relative to true north). It is projected to continue into Russian waters in the near future (Kyoto University).
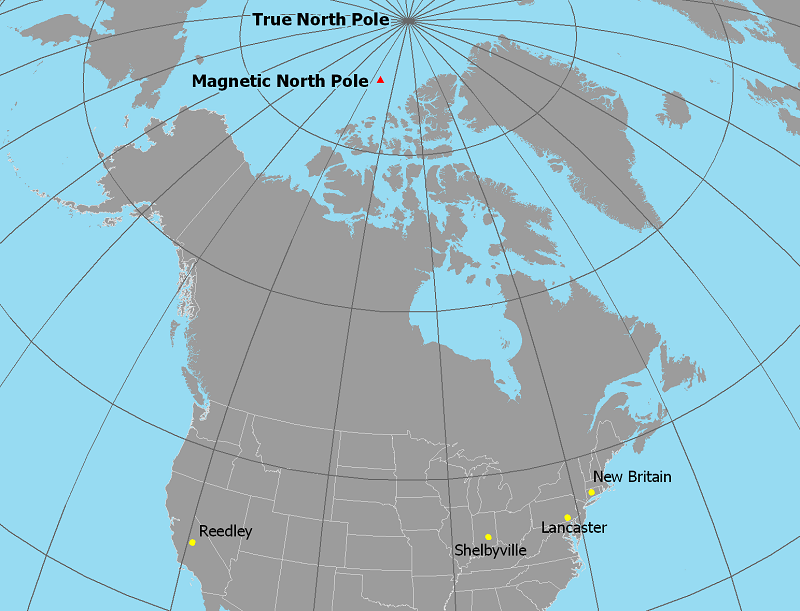
Isogonic Lines
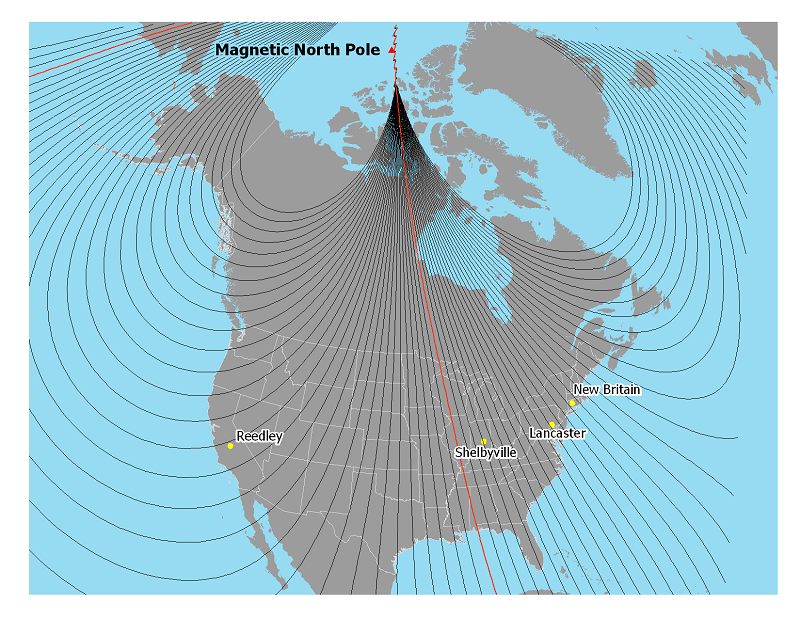
You might think that the locations with 0° magnetic declination are the ones located on the same meridian as the magnetic north pole, which would make the two poles line up perfectly (in North America). As a matter of fact it does not work that way at all. The proper term for these "lines of equal magnetic declination" is isogonic lines. The map below is a map of isogonic lines. The red isogonic line is the line of 0° magnetic declination locations. Each line to the east of that line adds one additional degree of west magnetic declination (the declination diagrams of places on the line show magnetic north to be that many degrees west of true north).
The reason why the isogonic lines appear so distorted has to do with the fact that the components of the Earth that give it its magnetic properties are unevenly distributed beneath the Earth's surface. That is all we need to know for the purposes of this course.
Grid North
Grid North refers to the UTM grid, distinct from the latitude-longitude graticule. We learned that the latitude-longitude graticule is not the only grid that can be superimposed on the Earth. We learned some of the basic characteristics of the UTM grid; for example we learned that the grid the name refers to has been embraced by the military as a way to simplify coordinate calculations, and that it divides the Earth's surface into long, north-south-oriented zones, only 6° of longitude wide. Each UTM zone is based on a rectangular cylindrical map projection aligned with the western meridian (longitude) of the zone. All measurements within a UTM grid zone are made to the east from that starting meridian, and north from the equator for North America.
This structure means that, from any position off of that western meridian, any direction pointing toward Grid North within that UTM zone will be parallel to that western meridian, but will not be in line with True North.
So, unlike true north and magnetic north, grid north does not point toward a unique point on the Earth. If you were using the declination diagram to report the direction difference between true north and grid north (which we will not do in this course), you would refer to it as the "grid declination" for that map. It was already stated that understanding the UTM grid will not be a major concept in this course, so that is all you need to consider.
Magnetic Declination
Defining Declination
Because true north and magnetic north are not the same point, from most places on Earth you would look in two different directions to see them, if you could (see the maps above). The US Geological Survey realized the fundamental importance of this concept, and has incorporated it into all of their topographic quadrangles. The reason for that is that many of the users of these maps are hikers and others who use them to navigate in the wilderness. It is much easier to do calculations relative to true north, but we must have a means to calculate the difference from magnetic north in order to follow the right direction on a magnetic compass.
The word declination means "difference in direction," such as that difference in direction between true north and magnetic north that is referred to as the "magnetic declination." Magnetic declination can be shown visually on larger scale maps, such as the USGS quadrangles, and the measurements used to determine those direction differences can also be used in calculations.
Declination Diagrams
Displaying and calculating direction differences on USGS maps is accomplished with what is called the map's declination diagram. The diagram shows the difference in direction between true north and magnetic north as two lines pointing in different directions on most (except where that declination is 0°) USGS quadrangles. The line pointing in the direction of True North is labeled with a star symbol (representing Polaris, the North Star) and the line pointing toward magnetic north is labeled with "MN." If the map also includes directions relative to the UTM grid (or the related Military Grid Reference System), then a third line labeled "GN" and described as "Grid North" will also appear in the declination diagram. The grid created by the State Plane Coordinate System is not represented in the declination diagram.
The second map above showing the isogonic lines across North America also shows the locations of four different USGS topographic quadrangles. Below are four declination diagrams from those quadrangles, corresponding to the quadrangles closest in date to the two 2009 maps (above) depicting the North Pole. The declination diagram reports the direction difference between true north and magnetic north, referred to as the magnetic declination of that map. Report the declination in degrees only; ignore the "mils" measurement. "Mils" is not the same as miles; it represents a different measure for reporting angles.
When reporting the magnetic declination of a USGS map, always say whether magnetic north is east or west of true north.
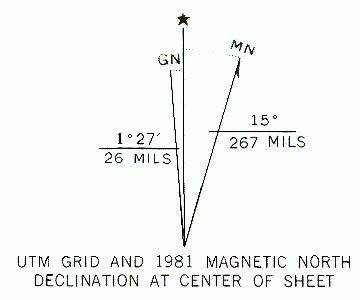 The declination of Reedley, CA
 |
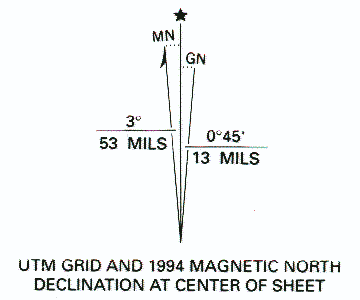 The declination of Shelbyville, IN
 |
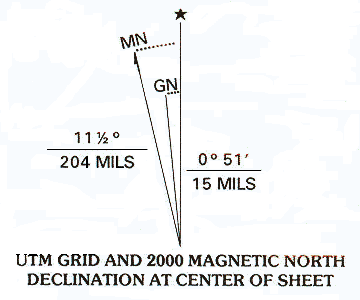 The declination of Lancaster, PA
 |
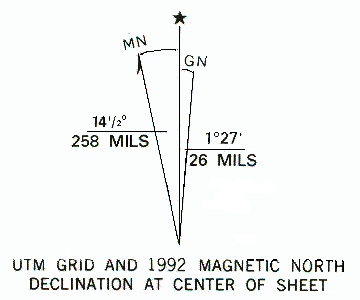 The declination of New Britain, CT
 |
Notice that each declination diagram specifies that the declination is "at center of sheet." The statement is referring to the fact that, even at the larger scale of a USGS 7.5-minute quadrangle, there could be direction differences between two different points within this map. The direction depicted in the declination diagram as True North is drawn in the same direction as if it were drawn at the exact center of the quadrangle. If you can look at the quandrangles immediately west and east of the quadrangle whose declination diagram you are examining, and if those quadrangles are as close as possible to the same date as your quadrangle, you might see differences between the magnetic declinations of those maps.
Reporting Directions as Azimuths
True Azimuth
Measuring a True Azimuth
You have probably been taught about geographical direction using the points of the compass rose. That system is fine for general use, when that level of precision is adequate. With just the four cardinal directions, your precision is 90 degrees of the 360-degree circle. If you add northeast, northwest, southeast and southwest, your precision is 45 degrees of the circle. And finally, if you add north-northeast, etc. (eight additional combinations altogether), your precision is 22.5 degrees. In many technical applications of maps, that level of precision is still not enough.
There are several technical systems for reporting a direction to the nearest degree (and any fraction of a degree). All of these systems involve the use of maps and protractors for making those angle measurements. Some involve the use of the four cardinal directions, with the protractor used to measure angles from those primary directions. We are going to use the simplest of those systems, measuring all angles clockwise from north only. This is referred to as the azimuth system.
Notice that I said that all angles will be measured from north, without specifying which north. In the azimuth system, the north that you are measuring from becomes part of the reported direction. Sample directions relative to different norths are: 328.4° True Azimuth, 192° Magnetic Azimuth, or 46.9° Grid Azimuth, measured relative to true north, magnetic north and grid north, respectively.
Measuring a True Azimuth on a Paper Map
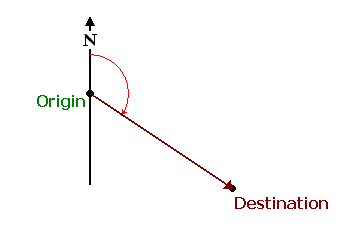
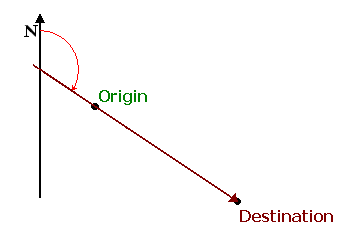
To make a true azimuth measurement: start with the locations of your starting point, or origin, and the point that you are looking toward, your destination. We'll refer to the straight line from the origin through the destination as the direction line. The goal is to measure the angle formed by a true north line that runs through your origin intersecting your direction line, as shown below. Set the center point or pivot point of your protractor on the origin, line up the 0° line of the protractor with your true north line, and read the angle that proceeds clockwise from due north of the origin to the direction line.
Measuring a True Azimuth in Adobe Reader
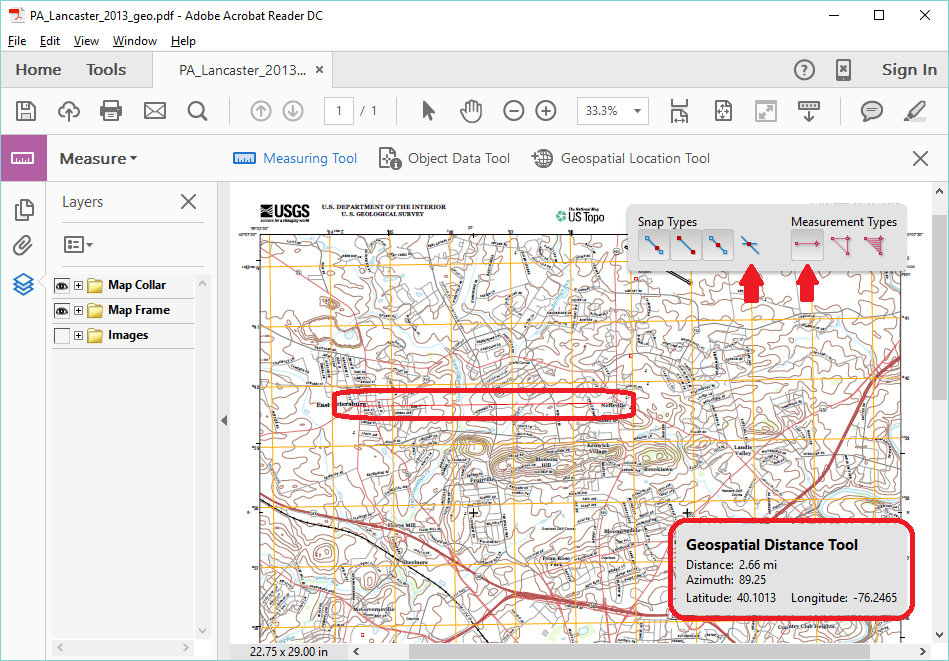
Adobe Reader also provides a way to measure the true azimuth. Open the USGS quadrangle map document with Adobe Reader. Above the map is a Tools tab; select that tab and find the link for the Measure tools. Clicking on that link will activate a toolbar above the map with three tools, one of which is titled "Measuring Tool." Activating the Measure Tool will open two additional panels within the map, and will change the cursor to a crosshairs. Click (single click) on your starting point, or origin, and then again (single click) on the point that you are looking toward, your destination. The straight line from the origin through the destination is the direction line. The lower information panel reports the True Azimuth as simply "Azimuth." In the image below, showing the Lancaster (PA) quadrangle open in Adobe Reader, a direction line (circled) was marked from East Petersburg, northwest of Lancaster city, to Neffsville, north of the city. The Azimuth measured is 89.25°. The image also shows the Tools tab, the Measure toolbar, and the Measuring Tool, the latter highlighted in blue. In addition, the upper Measuring Tool panel shows two potential controls, which were left at their default settings.
We saw the basic procedure for measuring a true azimuth, but there are two situations that add a little complexity.
First, it is important to remember that the clockwise angle measurement can range from 0° all the way to 359° (or 359.9°, etc.). There are no counter clockwise angle measurements and no negative angles reported.
When you work with paper maps, you use a protractor, since most protractors measure up to 180°, for an angle greater than 180° the best strategy is to set up your protractor the opposite way to measure clockwise from south of the origin, and add the 180° to your measurement.
Using Adobe Reader to view a digital version of a map in GEO-PDF format, the software will report the azimuth relative to true north clockwise to a maximum of 180°. Any direction angle greater than that will be reported as a negative value, measured counter-clockwise from true north. The correct true azimuth reading is easily calculated as 360° minus the negative angle. For example, if the azimuth reported is -162.5°, then its actual value is 197.5° TA.
Second, the last page contained an assumption that you could find or construct a true north line exactly through the origin point. Although that situation will hardly ever be true, it only needs a solution when working with paper topographic maps. In that situation an easy alternative is available. Extend the direction line beyond the origin or destination until it intersects the east or west edge of the map. If you remember your geometry lessons, the extended direction line intersecting the side of the map forms the same angle as if the true north line ran through the origin. They are referred to as equivalent angles. The diagram below illustrates this concept.
Magnetic Azimuth
Calculating a Magnetic Azimuth
You have seen how to measure a true azimuth using a paper topographic map and protractor, and also using a digital topographic map in Adobe Reader. The magnetic azimuth was described as the same type of clockwise angle, but measured relative to magnetic north instead of true north. However, other than the declination diagram, the magnetic north line does not appear on the topographic map. It is not practical to try to extend that tiny representation of the magnetic north line to other parts of the map.
The alternative is to measure the true azimuth, and then use the declination value given in the declination diagram to calculate the magnetic azimuth. In the video example previously used, the direction from the water tower on Chestnut Ridge looking toward Park City Mall was measured as 68° True Azimuth. The declination diagram on the Lancaster USGS topographic map shows that magnetic north is 11.5° west of true north. Therefore, the angle from magnetic north to the same direction line is 11.5° larger than the angle measured from true north. The same direction, from the water tower to Park City, should be recorded as a 79.5° Magnetic Azimuth.
Whenever magnetic north is west of true north, as it is in the eastern US, you will add the magnetic declination to the true azimuth in order to calculate the magnetic azimuth. The opposite is also true: whenever magnetic north is east of true north, as it is in the western US, you will subtract the magnetic declination from the true azimuth in order to calculate the magnetic azimuth. Remember, toward the central part of the country the declinations get smaller and the decision of whether to add or subtract might be harder. The safest thing to do is to draw the declination diagram superimposed on your sketch of the origin and destination, whether the magnetic azimuth should be smaller or larger than the true azimuth should be clear from such a drawing.