Calculate Map Relief
Calculate Point Elevations
We wrap up our discussion of contour maps with several applications of understanding contours. Always try to examine contour maps closely, and try to picture the landscape it represents. Ask as many questions as possible about the area you are looking at. Try to visit it, or try to find the topographic map of an area you know well.
Professionals who use USGS topographic maps apply their knowledge in a variety of occupations. They look for different landscape elements, depending on their job or on their objectives at the time. But they all share the skill of looking past the symbols and reading more meaning into the landscape than what the map shows. On these pages you will see a few examples of this idea.
Determining a Point's Elevation
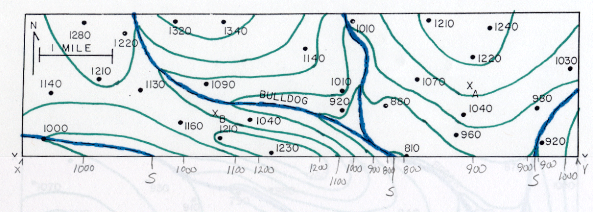
If you want to know the elevation of a point visible on a topographic contour map, that is not right on a contour line or spot elevation, that value can be determined using the same process of interpolation we looked at earlier.
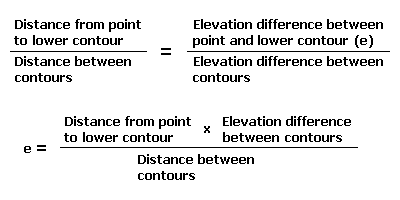
Draw a straight line through the point of interest between the nearest contour line on each side. Measure the length of that line from contour to contour. Then measure along the line from the point of interest to one of the contours. Calculate the elevation difference between the two contours. Then apply these values to the following formula:
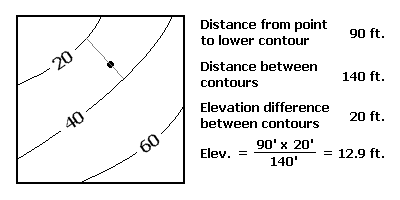
The proportional relationship between elevation and distance results, in this case, in a value of 13 feet (approximately). Interpret this as the elevation to add to the lower contour value you used in the calculation. In this case, 20 feet plus 13 feet equals 33 feet, which is the elevation we were seeking.
Calculate Map Relief
Relief is the simplest calculation, because all it requires is a simple subtraction. Relief is the difference between the highest elevation on a topographic quadrangle and the lowest elevation on the same quadrangle.
The real challenge here is finding those elevation locations. If you don't think about the landscape it is like finding a needle in a haystack. If you apply simple common sense about what you are looking at, it becomes easier.
Finding the Highest Elevation
The highest elevation in an area is usually a location of some significance to the locals. Even in a non-mountainous landscape, it might be named Mount something, something Ridge, Lookout, Overlook, or some similar name. Many such local descriptive names are printed on USGS topographic maps. What other feature names or types can you think of that suggest higher land areas?
The highest elevation can be either a spot elevation, or a contour line that encloses a hilltop.
Most land areas have a certain predictability to them (although we will view some that are very unpredictable). Often one side or corner of the map is higher than the rest of the map, and that is pretty easy to confirm. Then it just becomes a process of scouring that smaller area for the hilltop elevations or other prominent points.
Finding the Lowest Elevation
The best clue to finding the lowest elevation in a landscape (except in a desert area) is water. Water always flows downhill and usually settles in the lowest elevations. In fact most of the time, the largest lake, river or other water body will have the lowest elevation. Again, there may be other place name clues that will help. Valleys, hollows and draws are generally low-lying areas.
Because it is one of the easiest values to determine, you will be asked to find the relief of most of the topographic maps you use in this course.
Slopes and Profiles
Calculating a Slope or Gradient
Calculating Slopes Using Contours
Hopefully you remember the mathematical definition of slope as "rise over run."
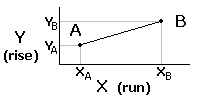
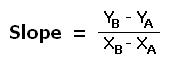
The geographical version of this formula says that the slope of the land between two points is:
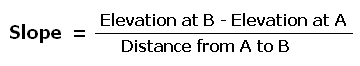
Normally this gives us a very small value, which is then expressed as a percentage. A slope calculated as 0.1 represents a 10 percent slope.
On topographic contour maps you can find the slope between any two points by applying skills you have already learned. Locate each point, determine the elevation of each one, and measure the distance between them. Apply these values to the formula above to calculate the slope.
Is the Slope Gentle or Steep?
One question that will arise is whether a slope is gentle or steep. Like the question of whether a map is small scale or larger scale, it is better to make the distinctions in relative terms.
One basis for comparison that many people can relate to is steep hills that they have driven up or down in their car. Most steep hills are labeled with a warning sign that states the slope. Slopes that are steep for smaller cars or for tractor trailer trucks with heavy loads are in the range of 8 to 15 percent. The construction of the railroads in the late 1800s and early 1900s, and of the Interstate Highway system in the second half of the 1900s, led to standards that included a maximum slope of 2 percent whenever possible. Stretches of uphill highway that exceed those standards include extra truck lanes; stretches of downhill highway that exceed those standards include runaway truck ramps made of loose gravel or made of a series of barriers designed to slow the trucks down.
Map Profiles
What is a Map Profile?
Map profiles give their makers the ability to visualize slopes, hill crests and valleys. A map profile is a cutaway side view of the landscape along a certain line on the Earth's surface. One sample application is to create a map profile along a proposed highway route so that the engineers can see what slopes might cause construction challenges. A steep-sided valley might require the construction of a bridge, or might just need to be filled in with crushed rock to raise the roadbed. A steep-sided ridge or mountain might justify a tunnel, a road cut or a long diversion around the trouble spot.
Constructing a Map Profile
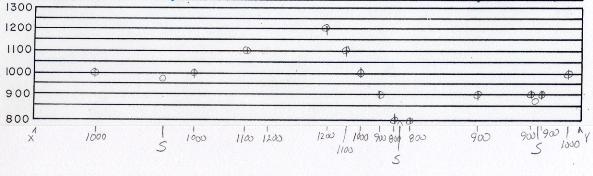
A map profile along a straight line is easiest to construct. Start with a topographic map (that includes contour lines) of the area to be profiled. Lay the edge of a sheet of paper along the line. At every point where a contour line on the map intersects the edge of the paper, make a mark and label the mark with the elevation of that contour. Determine the lowest contour elevation and the highest contour elevation.
In the next step you set up the chart. Any horizontally lined paper will do, unless you have strict specifications for the spacing of the lines to follow (for example, from an employer). Choose a line to represent the lowest elevation, and then label each successive line going up the page with the next higher elevation according to the contour interval. The next step is to lay the edge-marked paper along the bottom line of the chart. Then, directly above each mark place a dot on the line that matches that mark's label. The key to making this chart accurate is to make sure that from the mark on the separate paper up to the dot on the chart is a perfectly vertical direction.
Finally, once all of the dots are in place, connect them from one side of the chart to the other. As with the process of drawing contour lines, the line drawn on the profile should curve smoothly, and should not consist of short straight line segments.
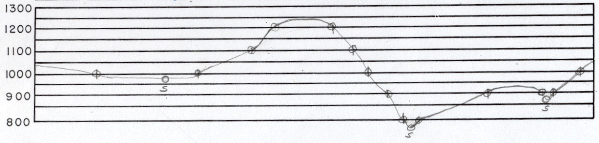
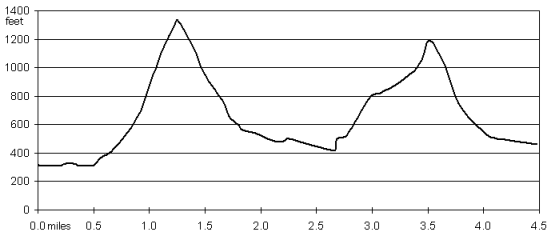
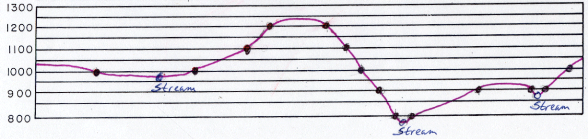
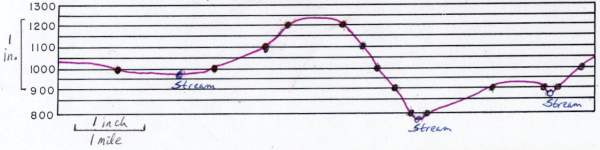
My finished product has the profile line darkened. I have emphasized the elevation points for your benefit. On a professional map profile you would see just the graph lines showing elevation and the profile line. Streams are marked to show their positions in the valleys.
Map Profiles and Vertical Exaggeration
Remember Vertical Exaggeration?
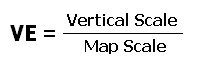
One characteristic of the map profile is called by a familiar term: vertical exaggeration. The cause is the same one that we saw in our discussion of the plastic raised relief map, as well. Because the profile is created by placing the marks on the edge of the paper exactly where they were positioned on the contour map, the scale along the bottom of the final chart is the same as the map: 1:24,000 or one inch represents 2000 feet. The scale along the vertical scale of the chart, representing the map elevations, depends on the spacing of the horizontal lines on the chart. Use a ruler to measure one inch of paper and determine how many feet of elevation that one inch represents. We now have two measurements, one horizontal and one vertical, each representing one inch of the chart.
The formula for calculating the vertical exaggeration is:
An Example
Here is an example based on the map profile I created for one of the maps you used to practice drawing contour lines. Here is the map profile again. I have reproduced the scale that appeared on the map (on my original, that is), and I have added a vertical representation of one inch (on the same original).
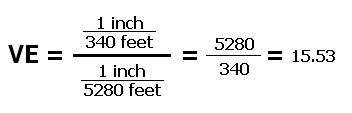
The final step in determining the vertical exaggeration of the map profile is this calculation:
Explanation
The calculation is possible only if the two scales are inserted into the equation in what we earlier called the basic form. That way you can work with the units if needed. The objective is that all of the units will be cancelled out in the calculation. The result is a number with no units. In almost all cases the numerator will be larger than the denominator, so the answer will be a number greater than one. That number represents the number of times longer a certain length is vertically than it is horizontally. For example, if VE = 10 then a 200 feet vertical distance is 10 times longer than a 200 feet horizontal distance. In our example, VE = 15.53.
If the map profile were squished vertically to one sixteenth (approximately) of its current height (but kept its current width), then one foot of distance would be represented by the same amount of space on the profile as one foot of height. Why do they exaggerate profiles? Map profiles make it clear where the steeper slopes are and where the valley bottoms and hilltops are. If the profile had no exaggeration that would be difficult to see. It would only be clear to us if we were standing in that unexaggerated map profile, closer to the same scale as the profile.
Estimate Volumes
Three-Dimensional Volumes on Two-Dimensional Maps?
We reviewed earlier the process of measuring the lengths of curving lines and the areas of irregular shapes. These measurement strategies can be extended to looking at volume measurements, such as determining the volume of water needed to fill a proposed reservoir.
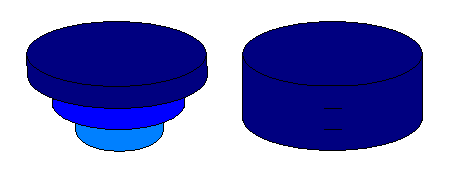
The process is similar to another process we looked at earlier, in the construction of a plastic raised relief map. The dam to be built will have a particular height; in other words the top of the dam will reach a certain elevation. Trace the water level behind that dam as a supplementary contour line on the map. Treat each contour line within that outline as an area to be measured, and multiply that area by the contour interval as a height.
Repeat the process for the entire stack of contour lines, and then add all of the partial volumes together to get the total volume. It will not be a perfect measurement, but will be a good approximation. The illustration below begins to show the concept if we are talking about a rather circular lake, whose bottom is shaped like an inverted cone (left), or is more straight-sided (right). If the shape of the depression is irregular, such as the example of the quarry pond in the unit on map scale, you can visualize many different three-dimensional shapes whose volumes can be measured and added together.