Land Building Processes
The Structure of the Earth
A Matter of Layers
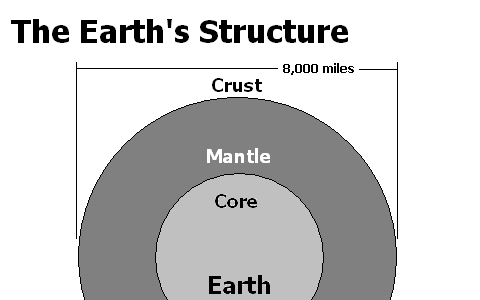
The Earth is composed of three concentric layers. As you review them, keep in mind that the diameter of the Earth is about 8,000 miles.
The core occupies the center, and is dense and hot. It is surrounded by the mantle, which is still extremely hot, but is a thick, viscous fluid in motion. The crust is the thin outer skin of the Earth.
To us the crust feels solid and unyielding, stretching 30 to 100 kilometers (20 to 60 miles) below us beneath the continents, and from less than 10 to as much as 30 kilometers (six to 20 miles) thick under the oceans. However, the 25 mile thick continental crust on an 8,000 mile (diameter) Earth, represents only 3 tenths of one percent of the cross section of the Earth (USGS). To put that in perspective, a typical globe is 12 inches in diameter, and if the crust's thickness were represented accurately, it would be 0.0375 inches thick, or 1/32 of an inch thick. The plastic ball that the printed globe is pasted onto is thicker than that, so that it doesn't break too easily.
The Importance of the Mantle
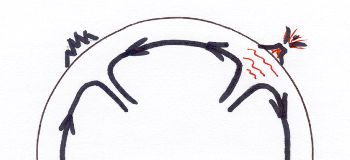
Not only is the Earth's crust fragile, but it is also in constant motion. The fluid nature of the mantle is the cause. Heat zones of varying relative temperature causes the development of thermal currents within the mantle. Beneath any one point on the Earth's crust, including under the oceans, movements in the mantle's magma can be exerting upward pressure on the crust, lifting it higher in elevation; can be dragging the crust sideways in any direction; or can be creating a pocket that allows the crust to sink lower.
The magma is such a thick fluid, though, that we barely notice the rising, falling or sideways shift. The movement in many areas of the US is as little as 1/32 inch in the course of a year, while in other areas it can be as much as 5 inches.
Plate Tectonics
Tectonic Activity
The movement of magma within the mantle makes the crust just fragile enough that it cannot maintain itself as a single continuous layer of thick rock. Where weaknesses occur, the crust breaks. Where continuous lengths of such breaks are aligned end-to-end and circle back to their starting point, a crustal plate is defined. Some such plates are relatively small, but some enclose entire continents.
To add to the dynamic nature of the forces that form these crustal plates, the mantle currents drag them around the Earth's surface, pushing and pulling on neighboring plates as they go.
In some areas the currents carry two crustal plates toward each other, with the collision causing the upheaval of tremendous amounts of the upper layers of the crust's bedrock. Many of the Earth's great mountain ranges developed this way, including many which are no longer visible on the surface.
In other areas, the movement of one part of the crust gets caught or hung up on another part. Tensions builds over many years or even decades while the pressure to shift builds up. If the shift happens all at once, of course, we on the surface experience an earthquake.
In still other areas, upward magma currents in the mantle break through the crust, causing volcanic eruptions on the surface. The US has many of these tectonically active areas.
Plates that Move
The result of this tectonic activity is that the Earth's plates jostle each other for size and position in a way that is similar to the extensive atmospheric air masses that drive our weather systems. Of course the key difference is that air is more fluid than solid rock and so the speed with which change occurs is much faster in the atmosphere.
The extent and rate of movement that occurs in the atmosphere on a daily basis takes many millions of years in the mantle and crust. The same forces are at work: uneven heating of the fluids involved, and the forces of acceleration and friction driven by the rotating Earth and by gravity. Additional parallels can be drawn in looking at the occasional periods of violent conditions: storms caused by colliding air masses are similar in some ways to the violent upheavals that give rise to mountain ranges.
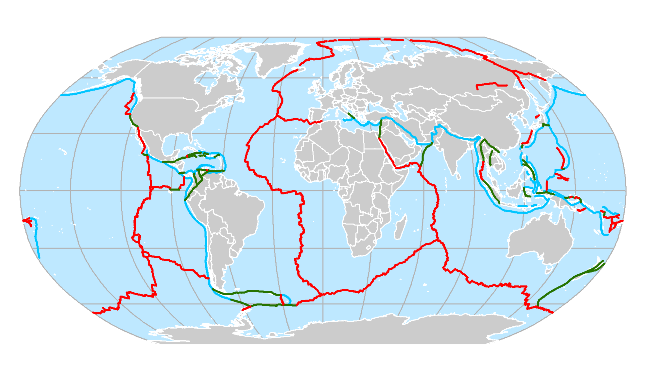
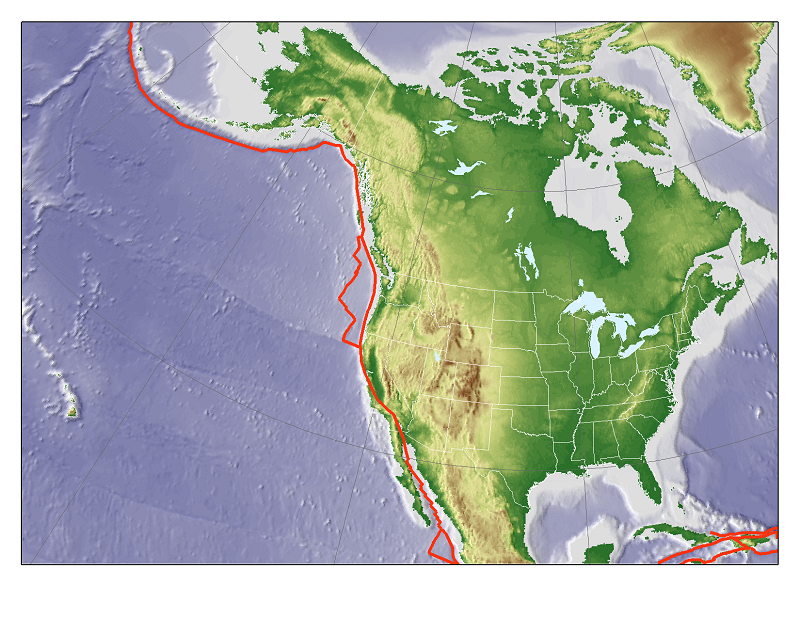
In the map above, the different colors represent different types of plate boundaries, much like the different weather fronts in atmospheric systems. (We will not worry about identifying or explaining those differences in this course.) The plates surrounding North America today have all had some impact on the development of North America into its present size and shape. In fact, notice that the North American plate encloses the North Pole area as well as a large chunk or Russia and Greenland.
We are going to simplify the geological complexity of the tectonic processes to three significant geographical movements: Some land areas are rising in elevation due to tectonic forces within the mantle, others are being worn down by erosion, and some areas are moving in spatial location.
Major Events in America's Tectonic Past
Where is America, Tectonically?
Keep in mind that, while the Earth's tectonic plates have been in motion, the Earth has maintained two other kinds of motion: the daily rotation of the Earth on its axis and its annual journey around the sun. The rotation in particular means that the position of the Earth's graticule of longitude and latitude has not shifted significantly. That has enabled geologists to create maps of past positions of the continents and other plates.
Most of the United States is located on one continental plate, known as the North American Plate. Hawaii is on a separate tectonic plate called the Pacific Plate, as shown in the diagram below. The North American continent has gone through tremendous amounts of movement in all three directions (upward, downward and across the surface) since its core formed about 2.5 billion years ago.
For much of that geological history our continent was located south of the equator and oriented perpendicularly to our present position, with positions north of us today located east of us back then. Many of our deeper layers of bedrock show evidence of that tropical history, including our deposits of oil and coal.
Also for most of our tectonic history the continent extended from the east coast of the US to its west coast. Today, the North American Plate of the Earth's crust includes the western half of the Atlantic Ocean. The opening (or spreading) of the Atlantic Ocean and our position shift to the mid-latitudes north of the equator have come in the last 250 million years or so.
The first link below takes you to a YouTube video of a geological animation by a well-known geologist C. Scortese (USGS) of the movements of the Earth's continents over hundreds of millions of years, based on geological evidence. In this case, the animation starts with a current map of the Earth and the continents move with time in reverse. YouTube will suggest other similar videos, several by the same person.

The next webpage link below, published by the US Geological Survey (Blakey), gives map representations of the North American continent at various times over the last 550 million years, again based on geological evidence. The links for the images of the oldest periods are at the bottom of the page, and those for the most recent periods are near the top. The link that says "TEXT" gives a summary of the major events of each period. This website requires a lot more opening and closing of links, but the graphics are very high quality.
Major Tectonic Features in North America
The mountain ranges of the US are the current result of hundreds of millions of years of tectonic change. This map will remind you of the main ranges of the continental US. The link at right will open a larger image of North America's landscape and some of its plate edges. Keep in mind that in the long-term future, on the same geological time scales, they will continue to change.
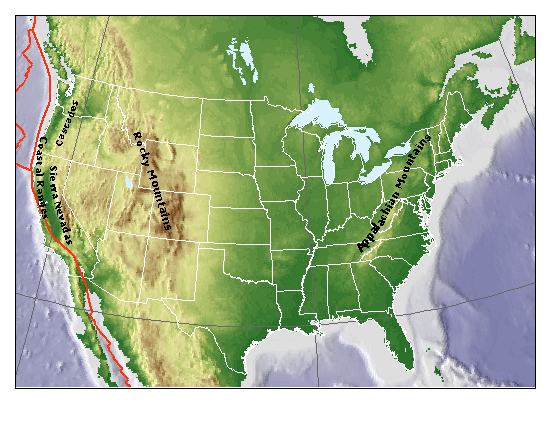
Orogenies build mountains. Tectonic mountain-building processes are known as orogenies. Most orogenies occur near the edges of continental plates, and this has been very typical in North America's geological history, with two exceptions: the development of the Rocky Mountains and the existence of the Hawaiian Islands (see below). Plate edges are more likely to be areas where the crust is weaker.
The other areas that exhibit recent elevation increases are plateaus. They are the result of upward pressure on the crust from immediately beneath, in the mantle. The Colorado Plateau, in the southwestern US, the Badlands of southwestern South Dakota (see the next page), and the Appalachian Plateau of western Pennsylvania are all areas that have risen in elevation in the last 10 million years or so.
American Mountain Ranges and Plateaus
In North America's history, during three different 40-50 million year periods, tectonic activity along what is now our Atlantic coast, east of today's Appalachian Mountains, led to mountain ranges 10,000 feet or more in height. In the periods immediately following the orogenies, erosion wore the mountains completely off the surface, although we still have evidence of those orogenies in the underlying bedrock. Since the opening of the Atlantic Ocean, that activity has shifted to the central spine of the ocean, which is a massive ridge of mountain that is almost completely undersea. The eastern half of the above-water North American continent has seen relatively little tectonic activity for the last 200 million years, and is still in its "wearing down" mode.
The western half of the US has experienced the most recent major orogenies on the continent. The growth of the Rocky Mountains, and of the Sierra Nevadas, Cascades and Coastal Ranges, has mostly developed within the last 100 million years or so, some as recently as 5 million years ago. All of these mountain ranges include areas that are more than 10,000 feet above sea level, among the highest in North America. The earthquakes associated with the San Andreas Fault represent obvious evidence that the coastal mountains and related areas are still tectonically active.
Even the area between the Rockies and the mountain ranges closer to the Pacific Ocean can be considered to be of recent origin and still undergoing change. This region is generally known as the Intermontane because of its relative location. It includes some very dramatic landscapes, from the Grand Canyon and the Painted Desert areas of the southwest to the Columbia River and other gorges of the northwest. The land in this region is generally at much higher elevations, even in the valleys, than much of the land in the eastern US.
USGS Quads to download and examine:
| Mount Saint Helens, WA | Inverness, CA | Grand Canyon, AZ |
|---|---|---|
| (7.5 x 7.5 minutes) | (7.5 x 7.5 minutes) | (7.5 x 7.5 minutes) |
| Volcanic mountain in the Cascades that erupted in 1980. | Northern end of the San Andreas Fault; look for the "Rift Zone" | Try calculating the map relief, and follow the hiking trail from the Grand Canyon National Park headquarters area down to the Indian Garden campground. |
Anomolous Tectonic Areas
The US includes a number of areas that are inconsistent with the larger story of the continent's geological history. Here are a few examples. The lesson here is to go ahead and use your general knowledge, but if an area doesn't seem to fit that picture, it is alright to wonder whether something else is going on. Do not try to force the fit.
Hawaii
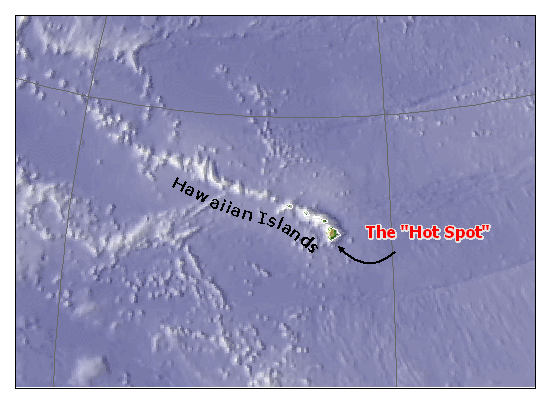
Hawaii is a volcanic island chain, but unlike most chains of volcanic mountains (such as Mount Saint Helens and its neighbors in the Cascades) and islands (such as the Aleutians of southwestern Alaska) it is in the middle of a tectonic plate, not near the edge.
Hawaii's position in the middle of the Pacific Plate demonstrates the impact that thermal activity in the mantle can have. Hawaii sits above a "hot spot" in the mantle, allowing the magma to penetrate the crust and erupt volcanically at a relatively small point. The crust is moving in a somewhat northwestern direction, making the northwestern-most islands in the chain the oldest. The volcanic activity continues today on the southeastern-most "Big Island," named Hawaii. The link at right (USGS) takes you to a Fact Sheet that describes the situation faced by people living on Hawaii's big island.
Here is a depiction of the undersea topography around the Hawaiian Islands.
The Badlands
The central Plains region of the US has seen very little tectonic stress, creating a very flat terrain, which makes the Badlands and Black Hills areas of southwestern South Dakota very unexpected. The Badlands in particular are an area known for very unusual rock formations and for yielding an amazing variety of fossils of early mammals and vegetation, dating from the last 35 million years ago or so. It is a barren and rugged region today, experiencing extremely rapid erosion.
The explanation is that the early geologic history of the area took place in a very warm and wet climate, like the rest of North America. Seventy-five million years ago an earlier version of the Rocky Mountains rose, and while eroding spread its sediment toward the region that includes the Badlands. Some of that sediment trapped the creatures whose fossils are now being found. About 5 million years ago, the Badlands area experienced a period of uplift, followed by a series of volcanic eruptions that spread a white volcanic ash over the landscape. The uplift sped up the erosion process to today's rates (see the next Unit).
The link at right connects to a 65-page on-line .pdf document written by a geologist with the US Geological Survey (Stoffer). The report describes the Badlands in great detail and with many color photos. I especially recommend using Google Maps (or a similar site) to view "Badlands National Park." Look at the satellite/air photo view to get the full effect.
Erosion-Dominated Landscapes
Erosion Rates and Factors
Land Can Erode Relatively Quickly
The land around our feet is eroding. Humans have altered the process significantly in areas they populate. In some cases, as with agriculture and suburban development, we have speeded up the process; in other cases, where we have built roads, parking lots and cities, we have slowed it down. But the ultimate process is still at work: the removal of tiny amounts of soil per year, on average, over tens of millions of years, will wear down even the tallest of mountains.
For example, we saw above that mountains once rose 10,000 feet or more just off the coast where New Jersey sits today. They rose slowly in comparison to our lifetimes: reaching 10,000 feet in 40 million years means an average rise of just three thousandths of an inch per year (although it's for sure that in some years it moved a lot faster, and in others it moved a lot more slowly).
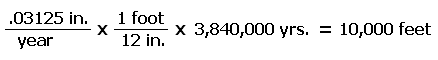
The average soil loss in the US is on the order of 1/32nd of an inch (0.031 inches) per year, which deposits around 4 tons of soil from each acre per year in streams and, ultimately, oceans. Would you notice that? And yet, after "only" 3,840,000 years those same mountains would be gone.
Erosion Factors
The erosion process consists of three stages: weathering, movement, and deposition. Weathering is the removal of particles from the bedrock. In the "movement" stage they are in transit, which means there is an action which gets them moving and forces which keep them moving. Deposition is the depositing of those particles, not just in their ultimate destination below sea level, but also in various temporary locations along the way.
Topographic maps capture an image of the landscape at a point in time. Even though the erosion process occurs microscopically, there are clues on the maps that show landscapes in transition. Some erosion is too slow for us to see a difference if an area is re-mapped every ten years. In other cases, though, dramatic changes have been documented at that mapping rate.
The primary mechanism of erosion, at all three stages, is water. A relatively small amount of erosion is driven by wind in dry environments, but water is common over most of the Earth's land surfaces, and can even be the dominant force in those dry environments. The water is a chemical agent that aids the weathering stage of erosion. Water is constantly in motion, which drives the movement of the sediment. And, when the water reaches slow points along the way or the deeper waters of the ocean, its reduced movement is the cause of deposition.
Water can also accomplish this work in a frozen state, as we shall see with the movement of glaciers. It even does some of the weathering as a gas, water vapor in concert with various air pollutants, to dissolve the binds that keep rock particles in place.
Once again, though, we need to think in terms of what can show up on topographic maps. We will therefore concentrate on landscape clues that soil and rock have been lost from a map area, and clues that a map area is receiving sediment.
Hydrologic Erosion
Runoff and Streamflow Factors
Hydrologic erosion refers to erosion caused by water, the liquid. The main factor in determining how much erosion takes place is the speed with which the water moves. The speed of raindrops (accelerated by gravity) hitting the ground is a major weathering factor, and the speed of water moving over the ground and into streams and rivers is a major transportation factor. In general, the faster the water moves, the more it can dislodge and make available for movement. The "more" in that sentence can refer to the quantity of particles and it can refer to the sizes of the particles.
The major factors contributing to faster moving water, and therefore faster erosion, are:
- A lack of obstructions, including the ability to flow in a straighter path.
- Steeper slope of the land or of the stream channel.
- Deeper water in the stream or river.
The obstructions are primarily vegetation for overland runoff. A greater presence of trees and other plants in a landscape increases the obstacles that will slow water down. Topographic maps will give us clues that can help in some investigations. Water flowing in streams can encounter stream vegetation or obstacles such as bolders. Streams that curve will also slow down the flow of water in them.
Slope is a factor for obvious reasons. The steeper a slope is, the more momentum water moving across it can pick up. Couple that with the nature of the land surface at the top of the slope and on the way down. Is it paved, exposed as bare soil or grass, or forested? A farm field or residential yard will exhibit small gullies at early stages of serious erosion problems. Eventually those gullies can become streams.
The initial movement of soil and rock particles, or sediment, is over land. At the scale of most maps (including their vertical scale: the contour interval), and at the frequency with which they are published, very little evidence of surface runoff can be seen directly. But the fact that we can identify, measure and calculate areas with steep slopes means that the maps can guide us in where to look for potential erosion problems.
Hydrologic Erosion in Streams and Rivers
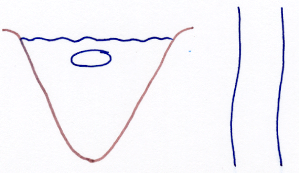
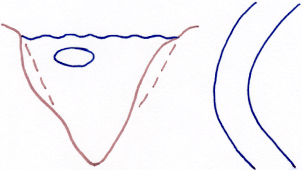
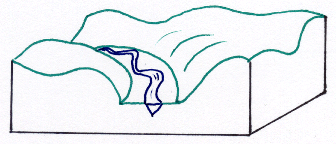
Streams and rivers are important because, not only are they the main "highways" of sediment movement, but they are also the location of a great deal of erosion along their banks. Streams and rivers cut valleys that are generally V-shaped. That valley shape extends down to the stream channel, as the cross-section diagram below illustrates. Note: at some point thousands of years ago or less, for a variety of reasons, a river valley may have filled with sediment. The modern stream or river may be much smaller than its predecessor. In such cases it is common to see a wider valley with V-shaped sides containing a small stream in its own V-shaped channel surrounded by a floodplain on one or both sides.
The right side of the diagram looks at the stream from an aerial (map) perspective, while the left side of the diagram shows the cross section.
Water Speed and Friction
Friction affects the speed of the water within its channel. There is friction between the flowing water and the channel itself, slowing down the water that is in contact there. There is even a little friction between the water surface and the air above. As a result, in the straight stretch of stream shown in the diagram above, the fastest-moving water in the stream is near the center of the stream cross-section, as shown.
If the water speeds up, such as after a rainstorm in the region or a dam burst upstream, the water in contact with the stream channel speeds up proportionally, and can carry away some of that channel, widening the stream. Conversely, if the water slows down, such as during a prolonged dry spell, sediment that entered the stream at a point further upstream will probably be deposited along the bottom or sides of the channel.
Hydrologic Erosion via Stream Meandering
The Meander Process
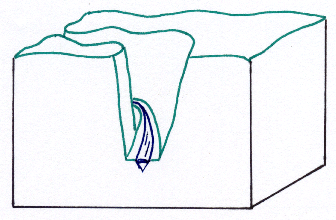
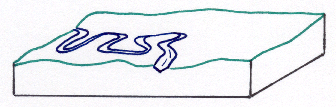
Stretches of a stream or river that are not straight (and most are) behave slightly differently than shown in the preceding diagram. As the stream rounds the bend, the water reacts the way you do when your car rounds a bend. Centripetal force pushes the faster moving water closer to the outside of the channel. The water on that side of the channel that is in contact with the channel is slightly faster, and more likely to cause erosion on that side, as shown in the diagram below. On the opposite side of the stream, the stream water that is in contact with the channel is slowed down even more because it is that much further from the effects of the fastest water. The inside of that bend in the stream becomes a place of sediment deposition.
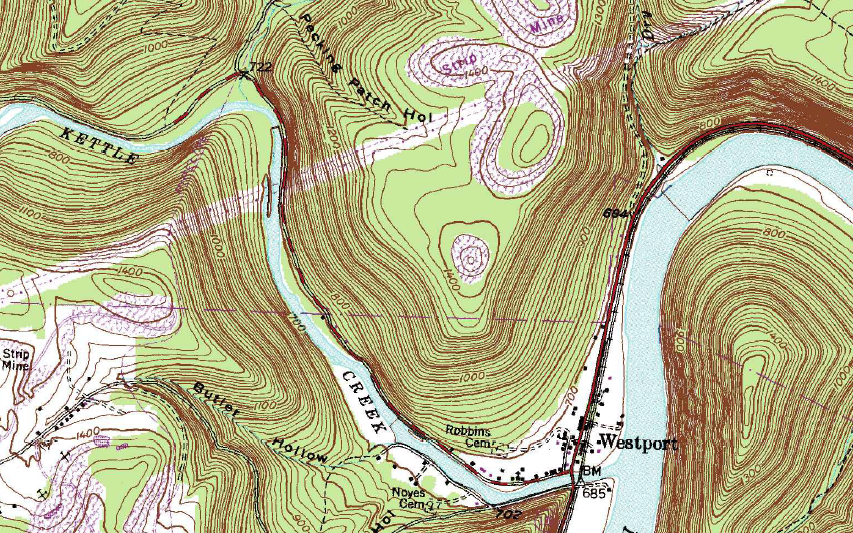
The linked area of a USGS quadrangle shows a stream named Kettle Creek rounding several bends as it travels along the bottom of a large valley. Notice "outer" edge of the stream tucks up right against the tightly packed contours that represent the larger valley. Then as the valley rounds a bend the stream curves back to the opposite side of the valley. This is very much the same type of reaction you feel in a car that drives along a winding road. Imagine Kettle Creek to be a road and imagine yourself as a passenger in a car on that road. Can you see that you would be "pulled" to the outside of those bends in the "road?"
Meander Extremes
The path of the stream now becomes dynamic rather than static. Over time the stream changes course. Hydrologists refer to the phenomenon as stream meandering. Depending on the nature of that surrounding landscape, the meanders might be confined to the adjacent floodplain within a wider valley, or might be able to spread far and wide over a flatter landscape.
Of course, the floodplain is called that for a reason, too. During high-water periods (caused by local rainfall or by upstream events) the water in the stream will move faster, but still may not be able to move fast enough to keep the flowing water at its normal level, and the stream can flood. The excess water during such an event will be carrying a lot more sediment because of the faster velocity of the water. In addition, when the water rises to flood level, the stream's effective channel becomes much wider. As the cause of the flooding subsides, the water slows and much of that excess sediment will be deposited across the floodplain and also on the inner banks of the stream, until normal water level and velocity reach a point of stability again. All of these factors result in the river shifting its course over time. Meander loops such as the ones depicted above can develop over the course of many rainfall events.
In a final stage of this process, especially as a result of a major flood event, the river course changes by taking a shortcut. Rather than flowing around the meander loop, it finds a shorter path by cutting a new channel straight through the flood plain. The former meander loop is no longer fed by the river, but is still fed by adjacent land areas and groundwater, now as a long narrow curved lake.
The quadrangle named below depicts the Red River as it meanders through southern Arkansas. Some former meander loops have been cut off from the river, and are now lakes. The river was represented in some historical editions of this map using purple instead of blue because its course had changed since the previous edition of the map.
| Garland, AR |
|---|
| (7.5 x 7.5 minutes) |
| Meanders in the Red River of southern Arkansas. |
Fluvial Landscape Ages
Fluvial Landscape Variety
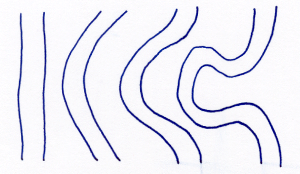
The stream erosion process has a powerful impact on all landscapes. Landscapes that were formed by more steady and widespread forces operating over long periods of time are more predictable in how erosion will wear them down. Landscapes created by more violent and sudden forces, such as eruptions and continental glaciers generally have more random and irregular elements to them. Those aspects of a landscape are detectable in the shapes of the contour lines representing them on topographic maps. On evenly formed and steadily wearing landscapes the contours will tend to stay parallel, even as they bend to show hilltops and stream valleys. Over more rugged and random landscapes, the contours will look very random also.
The erosion process is not the same everywhere, because there are many unpredictable elements that can alter a stream's course or the rate of erosion on sloped land. Looking for evidence along one particular stream will often leave you frustrated. Small and subtle elements can be hard to see on a topographic quadrangle. It is often more informative to step back and look at the broader view of a landscape; scan over the entire map for consistent and repeating patterns.
That is the principle behind the next task, learning to identify the "age" of a landscape being shaped today primarily by erosion. We are not looking for particular deposits of sediment or other features this time. Instead we are looking at the big picture.
Think of a landscape's "life" as beginning when tectonic uplift occurs. It is "young" at that stage, and as high in elevation as it can be, given the forces at work. Over time, erosion kicks in and as it moves into "middle age" it wears down in elevation and becomes more rounded as its elevations get lower. Finally, in its "old age" (tens or hundreds of millions of years) it is flat and close to sea level.
We refer to these landscapes as fluvial, which literally means "related to rivers." The river is the main path that the sediments take leaving the region, so the river and the land along it provide some of the clues we will use. In addition to rainfall, the river itself can also cause some of the erosion, from its river banks and river bed. As you view these landscape age descriptions and examples, keep in mind that your objective is to be able to look at a landscape that was uplifted through slower tectonic processes on a topographic map, and tell where it is along the age continuum.
Also keep in mind that a landscape can be in a period of transition from one age to the next. If it exhibits some clues that say "youthful" and others that say "middle aged" then that is a landscape that is in transition. You can identify it as either in late youth or in early middle age.
Youthful Fluvial Landscape
Youthful criteria
- Highest elevations in the thousands of feet (above sea level)
- Relief in the thousands of feet
- The higher elevations form a relatively flat upper level (which the rivers have cut into), and may be referred to as plateaus. Contour lines there may be somewhat random and widely spaced.
- The rivers flow in very deep, steep-sided canyons or gorges. Contour lines form sharp angles at the transition from plateau to canyon.
Youthful Example
Remember, this is a landscape that was recently (in millions of years) uplifted from a middle age or old age appearance. If the previous stage was old age the upper elevations will be flatter and the river gorges will show significant meandering.
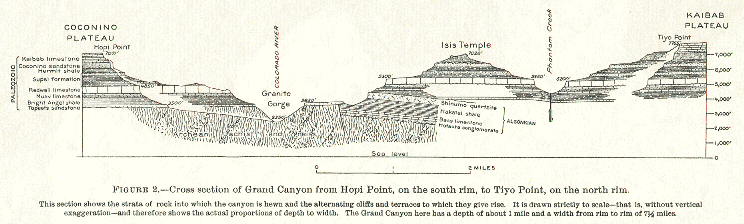
Prime example of this landscape: The Grand Canyon. Unfortunately the Grand Canyon is not easily depicted at a 1:24,000 scale. Smaller scales are better for seeing the big picture. For example, the diagram below, from the back of an older quadrangle (USGS) showing the Grand Canyon National Park area, is a map profile with no vertical exaggeration. The Colorado Plateau has been deeply cut by the Colorado River. See if you can calculate how much further it has to go before eroding its river valley (the canyon) down to sea level.
| Grand Canyon, AZ |
|---|
| (7.5 x 7.5 minutes) |
| Newer versions of this quadrangle do not have the map profile. |
Middle-aged (or mature) Fluvial Landscape
Middle-aged criteria
- Highest elevations in the hundreds of feet (above sea level)
- Relief in the hundreds of feet
- The higher elevations form a rounded undulating surface, lower near the rivers. Contour lines form a lot of parallel and smoothly-curving concentric patterns.
- The river valleys have more gently sloping (but still V-shaped) sides, and almost always show evidence of floodplains on one or both sides of the rivers. In wetter areas, such as eastern Pennsylvania, every downhill slope leads to a stream, although some may be too small to show up on a USGS topographic map.
Middle-aged Example
The rounded-but-not-steep nature of the landscape is very conducive to development. Smaller valleys are often attractive because the sediment washing downhill into them tends to improve the soil for agriculture. The hilltops are more likely to be undeveloped and left with a forest cover.
Human settlement is often attracted to the floodplain of the major river in the region because of its flatness, soil that is easier to work, and access to water, but they also often have to deal with flooding. Most often the development that is closest to the river is industrial or transportation-based (ports, railroad tracks and major highways), better able to recover after a flood.
Prime example of this landscape: Most of Lancaster County is a great example; the land right along the Susquehanna River is a bit inconsistent because of the steep drop from the inland part of the county to the river's lower elevation. Further south, in Maryland, the Susquehanna enters the Chesapeake Bay at Havre de Grace, MD. The landscape is still middle aged but the elevation change is not as steep (see box at right).
| Havre de Grace, MD |
|---|
| (7.5 x 7.5 minutes) |
| Havre de Grace, MD is located at the point at which the Susquehanna River empties into the Chesapeake Bay. |
Old-aged Fluvial Landscape
Old-aged criteria
- Highest elevations in the tens of feet (above sea level)
- Relief in the tens of feet
- The land is extensively flat. Ironically it may be higher in elevation near the rivers just because that is where flood sediment is most likely to be deposited. Contour lines (even with a very small contour interval) are widely spaced with more random patterns because there is little to alter the flatness.
- The rivers have no real valleys anymore. The entire landscape for tens of miles from the river is potentially all floodplain on both sides of the rivers. Human settlement is still attracted to the floodplain because of its flatness and access to water, but they are at tremendous risk from extreme flooding.
Old-aged Example
Prime example of this landscape: The southern Mississippi River valley, especially in Louisiana. The lower elevations and relief are so dangerous that the US Army Corps of Engineers has built extensive levees to try to prevent flooding. The levees generally work effectively for river flow changes, but were famously destroyed during the hurricane Katrina floods of New Orleans in 2005.
The map of Donaldsonville (quadrangle information below) shows a great example of an old-aged fluvial landscape. Donaldsonville is a town along the lower Mississippi, about 50 miles west of New Orleans. Calculate the relief of the quadrangle. After you look for the highest and lowest elevations, see how the low elevations are distributed. Then zoom in close and examine the levees along the river. What would they look like drawn as a map profile? Where is the human development concentrated?
| Donaldsonville, LA |
|---|
| (7.5 x 7.5 minutes) |
| Donaldsonville and all of southern Louisiana are located in an old-aged fluvial landscape. |
Glacial Erosion
Background
Water also erodes in the form of ice, known as glaciers. Since it has to stay cold for the water to retain its frozen form, only very special locations and conditions can keep a glacier going long enough to have a chance to cause erosion. The two scenarios we will examine are the continental glaciers of the last ice age, and the glaciers that still persist at the peaks of very high mountains.
Again, keep in mind as you learn to look for evidence of glaciers on topographic maps, that you might be given a map from anywhere in the country and asked whether it shows evidence of glaciations.
Continental Glaciers
Continental glaciers have covered extensive areas of some of the Earth's continental land areas, generally near the poles. For continental glaciers to form and move there must be a general lowering of the Earth's temperature by just a few degrees. Below is a link to a USGS webpage describing the last Ice Age (Schlee), including 2 maps of its southern limits about halfway down the page.
The last major ice age experienced by North America ended around 10,000 years ago after persisting for about 10,000 years. The ice originated in present-day Canada, which is an area that does not get much precipitation. Northern areas of Canada get maybe one and a half feet of snow per year; during modern time that area will experience a brief spring thaw, but during the ice age there were no spring thaws. Instead the snow kept piling up thousands of feet deep. The pressure at the top of this pile grew so great that it turned the bottom layers to a malleable consistency. The pressure was like what happens when you have a large ball of dough or clay and you put all of your weight pressing down on it. It squeezed out around its edges and pushed across the landscape in all directions.
The part that came toward the south travelled as far as temperatures allowed. When it got far enough south that seasonal temperatures melted the glacier as fast as it pushed its way in, that was as its southern limit. But in its travels across Canada and northern US states, it picked up and dragged along all of the dirt, loose rock and other surface materials it encountered. At its southern limit it dumped those materials as it melted, and evidence of that great influx of sediment, larger than any river could move, is still there.
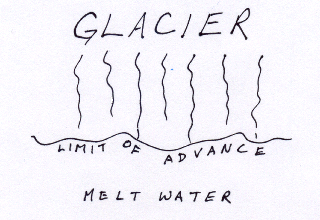
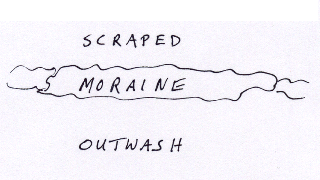
The impact areas of continental glaciers can be diagrammed and mapped. Glacial geomorphologists identify three zones of a North American glacial landscape, as shown in the diagram below. The "scraped" area is that area that had been covered by the glacier and felt the full force of the scraping ice flows. The "moraine" corresponds with the limits of glacial advance at which the debris brought in by the glacier is left behind in irregular, random hills. Finally, the "outwash" area was washed over by the melting front of the glacier; the effect was to spread the finer sediments across the area and create a flat, smooth surface.
Evidence illustrating the area of a glacial landscape that was scraped by the glacer shows up on USGS topographic quadrangles in several ways. The first way is the severely distorted and almost randomized contour lines of the "scraped zone" and the moraine area. They show that the scraped area was severely gouged and roughed up by the advancing glacier. Stream courses were often diverted, and now flow randomly across the glacial surface. Much of the landscape is challenging for people to develop because of predominantly swampy land.
Occasionally, rounded hills dot the landscape of the scraped zone; they are made of more solid rock that resisted the impact of the glaciers flowing down from the north. Near the southern limit of the continental glacier smaller scattered hills also appear within this scraped area, where clusters of sediment accumulated and were left behind when the ice age ended and glaciers melted away.
The quadrangle identified below is recommended for its depiction of a glacial scraped landscape in New England. Examine the rivers and swamps. If you download an older version of the quadrangle you will see that the Massachusetts Correctional Institution was located near the center of the map. Why do you think they chose to locate it there? What is there today?
| Bridgewater, MA |
|---|
| (7.5 x 7.5 minutes) |
| Quadrangle depicting a glacial scraped landscape area. |
The moraine area of a glacial landscape shows randomness and distortion in its contours, at locally higher elevations. These random hills are really piles of boulders, gravel and smaller sediment. The organic components of the original material transported by the glaciers have long since disappeared. At the same time, though, the thousands of years since the glacier disappeared have been easily long enough for a new layer of soil and vegetation to develop on the surface. In fact, there is a thriving economic activity in digging for gravel in these areas. You will frequently see symbols for "gravel pits" and "borrow pits" on USGS quadrangles in these regions.
Continue to examine the Bridgewater, MA quadrangle. Focus on the area around Middleboro in the southern portion of the map in order to find examples of the landscape elements just mentioned.
The outwash zone, if it exists, is usually flat and smooth because it represents an area where smaller sediment immediately south of the southern limit of the glacier simply washed out across the landscape as the glacier melted. It does not exist in some areas because of pre-existing conditions. In New England the glaciers pushed their way all the way into the ocean; such land features as Cape Cod and Long Island are moraine features. In Pennsylvania much of the outwash accumulated in river valleys and was later carried away as sediment down the Susquehanna and Delaware Rivers.
The link below takes you to a geological discussion, including a map, of glacial areas of Minnesota (Minnesota DNR). It divides the state into areas based on the ages of the glacial deposits and, within those age groups, based on the type of deposit (most are types of moraine deposits) without showing the actual landscape; it is an example of a nominal choropleth map. It shows that geologists have mapped layers of rock material left by glaciers, that are now below the surface soils, but above solid bedrock. They have maps that record bedrock geology to a level of quality and detail similar to the topographic maps we have been viewing. This state-wide map is a general compilation from such detailed sources. Look for the link to the larger version of the map that includes the legend.
Alpine glaciers
Alpine, or mountain, glaciers exist where the elevations are high enough (15,000 feet or more, depending on how far south they are) to prevent frequent melting of the glaciers. The source areas for alpine glaciers are generally smaller, and gravity (rather than pressure at the source) plays a greater role in the movement of the glacier. As with continental glaciers, once the glacier descends into more moderate temperatures, the ice melts and the debris and sediment are left behind. Unlike continental glaciers, the sediment does not accumulate at the glacier's limit, but is carried down the rest of the mountainside and ends up being deposited along the streams and rivers that originate in the mountains or carried in the rivers all the way to the ocean.
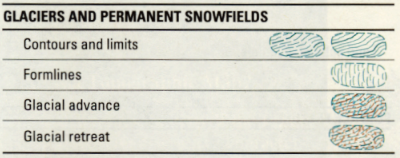
Location and elevation are the biggest clues to the possible recent or nearby existence of alpine glaciers. Actively present glaciers are marked as such on USGS maps.
The map to examine (below) is from Alaska, and shows a glacier that is making its way from mountains along the coast (an extension of the Coastal Range of the continental US) toward the Pacific Ocean, east of Anchorage. Even at this smaller scale, the detail is impressive. The fact that this map is dated 1950 shows that a) no significant human development has occurred here, and b) the glaciers are not likely the same size or in the same positions today as depicted in the map. You can also search for the Cordova area in the aerial imagery on Google Maps (or a similar site).
| Cordova C-4, AK |
|---|
| (15 x 15 minutes) |
| An active glacier in southern Alaska. Note: look for the 15 x 15 minute map, not the 7.5 x 7.5 minute map. |
Coastal Erosion
Coasts
The Two Kinds of Coasts: Rocky Coasts vs. Sandy Beaches
Coastal areas present a unique landscape that is both extensively populated and under the influence of many natural processes. While there are other unique landscapes that we are not covering in this course (deserts, for example) coastal areas are relevant for many reasons. It also helps that, in this part of the country, most people visit the seaside and many do so regularly, so there is again the ability to connect a familiar landscape with how it is depicted on USGS maps.
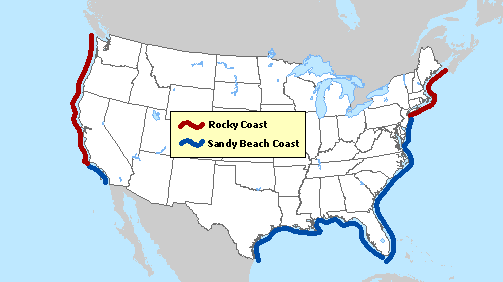
There are two types of coastal landscapes: rocky coasts and sandy beaches. The map below shows the general areas where each is found. Keep in mind, though, that rocky coasts do have the occasional sandy beach (usually near the mouth of a river), and that the extensive length of sandy beaches includes the occasional rocky point (although frequently those collections of rock were put there by people).
Rocky Coasts
Rocky coasts are limited to the northeastern coast, from Cape Cod northward to Canada, and the northwestern coast, from a little north of Los Angeles northward to Canada. In the northeastern US the rocky coasts are partly the result of the past tectonic history of the continent and partly the result of the last ice age. The rocky west coast of the US is the direct consequence of that also being the edge of the continental plate.
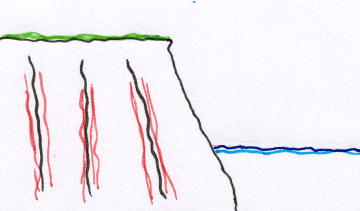
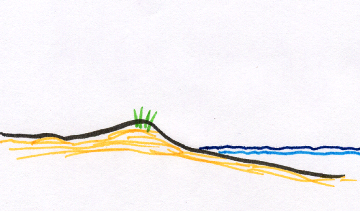
As the simplified cross section diagram below indicates, rocky coasts feature a steep slope and a rocky structure that resists erosion. Waves crashing against the coast will eventually weather away the rock, but it does not happen readily. The steepness of the rock face ensures that little sediment will accumulate, in any event.
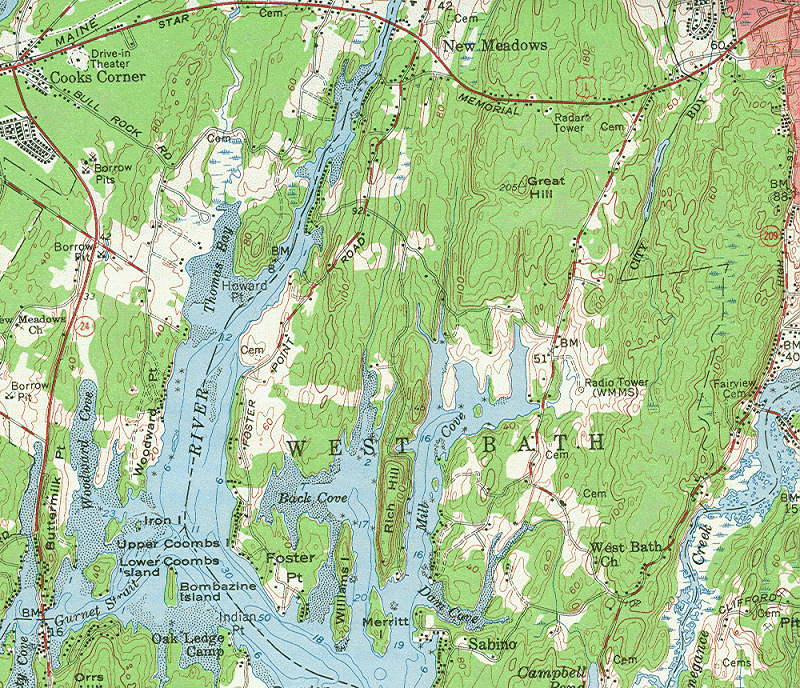
Rock hazards and lighthouses are among the coastal features common along much of this coast. Also frequent are narrow inlets that open into small bays and harbors, sometimes including mud flats and even more rock hazards. See the map linked at right of a small area of the Maine coast. It is from a 1:62,500 scale quadrangle, so it does not show the same level of detail as the larger scale 1:24,000 maps.
Note that the USGS strongly warns people against using the USGS topographic quadrangles as coastal navigation guides. The Coast Guard and other agencies cooperate to produce coastal "charts" (another word for maps) which are updated much more frequently and show other navigational details.
Erosion vs. Deposition on Sandy Beaches
Most of the country's coast, and conveniently all of the country's warmer coasts, are sandy beaches. They differ from the rocky coasts both in profile (see diagram below) and in composition. The sand is primarily sediment, on its way from land to deeper ocean waters. Unlike the rocky coast, there is a great deal of erosion and deposition, in constant motion. Unlike erosion and deposition on land, coastal sediment is going to "hang around" a lot longer before leaving the continent.
The key difference in the type of erosion, movement and deposition of sediment along a sandy coast is that it has less to do with elevation and much more to do with currents. One factor does remain the same, though. The faster the water is moving, the more sediment it can pick up and carry, but as soon as it slows down much of the sediment will settle to the bottom.
Longshore Currents vs. Onshore Flows (or Currents)
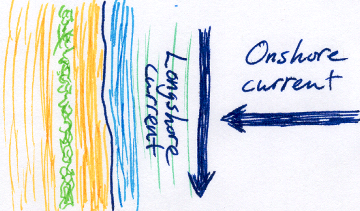
The map-like diagram below, drawn from an aerial perspective, shows that there are two types of ocean currents that are involved in coastal sediment movement. The longshore (or alongshore) currents move parallel to the coastline. They are primarily driven by the major deep ocean currents, the Gulf Stream in the case of the east coast of the US. Even though the deep ocean currents move in one general direction, this longshore current is not one directional; sometimes it flows southward along the east coast, but mostly it flows northward.
Onshore Erosion and Deposition
The onshore current is directed more or less perpendicularly at the shore. Wave action and tides are its main sources. In the bigger picture, the onshore flows either deposit or remove sediment (sand) from any particular beach, and the longshore current carries that sand up or down the coast from its origin to its destination.
You may have noticed that many seaside communities that depend on tourism for economic income, spend a lot of money attempting to keep their beaches the same from one year to the next. Unfortunately for them, that is not the nature of a coastline. It is much more consistently dynamic than it is consistently stable.
Wave Actions (Onshore Flows)
Waves play a major role in the appearance of the beach and in how it functions. Waves develop in deeper water, just offshore. You can recognize this, the next time you are at the beach, by the fact that waves start to form consistently at around the same distance from shore.
What is a wave in the open ocean? It is essentially a vertical water circulation (see diagram below) in deep water. The width of the top circle is the distance from one wave crest to the next. The vertical column of water circulation (the circles) stays in place as the top layer of circles interact with each other. The water at the wave's crest represents that part of the water column decompressing vertically while the rest of that column (heading down into the trough) compresses vertically. The circular nature of the water movement makes that crest appear to travel across that circle's area of the ocean. The result is that the water at the surface moves up and down in a circle transferring compression and decompression to the next circulation column as well as to the circulation cells beneath the surface layer.
You can prove this vertical "in place" water circulation by taking a raft out into water beyond the line at which the waves are breaking. The raft does not "travel;" it just stays in place moving up and down with that vertical circulation. This circulation is set in motion by winds blowing across the surface. The harder the winds blow, the deeper that circulation extends.
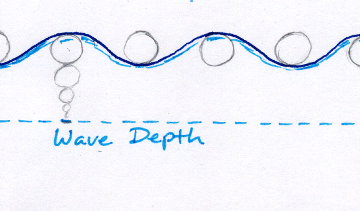
Why does a wave break onto the beach? The vertical circulation is disrupted when the water gets too shallow. That line, when the collective height of the circles in one column is the same as the ocean depth (the bottom circle is interfered with by the sandy ocean bottom), is where the waves break. Again, the calmer the wind, the smaller the circulation areas and the column depths, and the closer to shore the waves will break.
Along that line of breaking waves the water circulation is interrupted at the lowest depth, and transfers that disruption to the circular movements above it. In the top layer of circulation, there is a change from a vertical circulation to a horizontal flow across the top the water toward the shore.
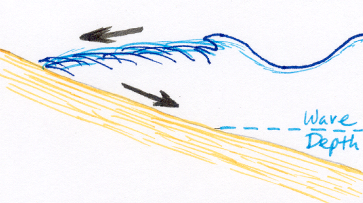
The circulating water now really is travelling toward the shore. If the circulation was vigorous enough to be carrying sediment, that sediment travels with the surface flow. As the surface water laps up onto the beach it slows down, dropping the sediment.
The water will then pick up speed (and perhaps sediment) on its way back to the ocean. The speed of this part of the journey depends on several factors, including its incoming speed and the slope of the beach. This time the journey continues along the bottom of the ocean away from the shore. We feel this as "undertow" if we are standing in the water.
More Erosion and Deposition along Sandy Beaches
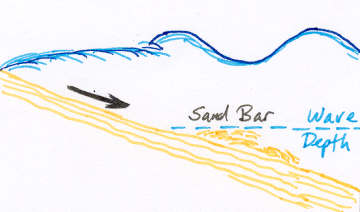
In that zone of breaking waves the water movement can be vigorous. But once the undertow water gets past the line of breaking waves, the water loses its vigor and deposits at least some of its sand. Sand bars form. Keep in mind that one strong storm with high winds (and deep water circulation) can wipe out a sand bar; on the other hand, the longer a sand bar is able to maintain its place, the more compacted and stable it will become. Eventually it can become virtually permanent.
Incidentally, the "groins" or "jetties" that beach communities build to try to disrupt the longshore currents and to keep those currents from eroding their sand are just as vulnerable to storms as the sand bars are. The groins are not likely to be destroyed, but the sand can be wiped out around them and the groins will be left sitting in the ocean dozens of feet from the shore.
Barrier Islands
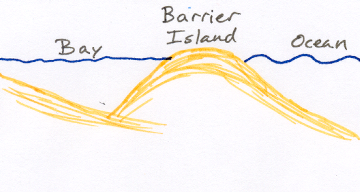
Extremely stable sand bars that grow a half mile or so away from the beach can eventually become barrier islands. From the perspective of the shore, the barrier island creates a narrow body of water between the mainland and the island. That water is brackish because it is fed both by ocean water and by freshwater from the land. In many stretches, it is filling with sediment and appears to be more swamp than water body. From the perspective of the ocean, the barrier island becomes the new beach.
Where are there Barrier Islands? Barrier islands actually extend almost the entire length of our sandy beach coast. If you have traveled to the New Jersey shore, recall that the last leg of your journey is probably over a drawbridge of some sort into your beach town. You crossed the body of brackish water onto the barrier island. North Carolina's Outer Banks are well known barrier islands that extend further into the ocean. The Florida Keys are the southern extent of the east-shore barrier islands.
Every so often, at irregular intervals, there are breaks through the line of barrier island that let ocean water into "the bay" (or whatever that coastal community calls the brackish water body), and let boats out into the ocean. That "bay" then represents a sheltered harbor for boats that venture onto the ocean for relatively short trips, for fishing, whale-watching, or other purposes. The bay also represents a sheltered passage for boats (that are also not suited for long ocean trips) traveling up and down the coast. It has become such an important waterway that the Coast Guard now keeps a channel through it dredged deep enough for fairly large boats to make the journey. It is known to the boating community as the Intracoastal Waterway.
The example suggested below shows the city of West Palm Beach along Florida's barrier island coast. On this map, probably an experiment by the USGS, they include color-enhanced depth contours in the ocean. Compare the ocean depths on this quadrangle with the fragment of a 1:62,500 scale map of the Maine coast earlier in this topic. Back on the Palm Beach, FL quadrangle, notice the narrowness of the barrier island on which West Palm Beach and the town of Lake Worth are built. Does knowing that it is nothing but compacted sand make you feel reassured about visiting there? Do you really want a beachfront house? (Note: taller buildings such as hotels do have to excavate down to bedrock in order to anchor their foundations.) Finally, zoom in on the swampy "bay" area and follow the Intracoastal Waterway.
| Palm Beach, FL |
|---|
| (7.5 x 7.5 minutes) |
| Palm Beach is built on a barrier island. |
Past Barrier Islands
We get used to thinking that the landscape that we see has always looked as it does today. Barrier islands are a great example of why that is not the case. While it is not necessarily the case along all sections of the coast that have barrier islands, it is certainly a phenomenon that can be seen along the Florida coast.
Consult the Sea Isle City, NJ USGS quadrangle (at right), for example. Look for a pattern of alternating strips, starting with the barrier island, of higher land and lower land. The higher land reaches elevations up to a few dozen feet above sea level. It is suitable for development or for agriculture. The lower land is dominated by swamps, lakes and other inlets. The straight blue lines in that area represent channels dug by people for a variety of purposes.
| Sea Isle City, NJ |
|---|
| (7.5 x 7.5 minutes) |
| Sea Isle City and most beach towns along the Atlantic Ocean are built on barrier islands. |
Sand Spits
What is a Sand Spit? Sandy Hook and the Florida Keys are examples of barrier islands that are at the "end" of a land mass, where the line of the land mass changes direction. The longshore currents cannot change direction to follow the coast, but once the currents carrying sediment get beyond the land mass and into deeper waters, their speed decreases and they drop their sediment load.
In Sandy Hook, NJ's case the coast turns westward as you travel north into the New York City harbor. Northward-flowing longshore currents have transported sand to the site and built up a small-but-significant land area. In fact, because Sandy Hook projects a bit into that harbor it was selected as the site for Fort Hancock, a military base that occupied the area between the late 1800s and the early 1970s. Shifting sands of the narrowest stretch of island leading out to the fort made it a challenge keeping a passable roadway after particularly strong storms. It is now part of a collection of sites known as Gateway National Recreation Area, part of the US National Park System.
On the Sandy Hook quadrangle look for the Shrewsbury "River," which is the northernmost end of the Intracoastal Waterway. In fact, if you download this quadrangle from several different dates, you can see a good example of just how dynamic these coastal landforms can be. While you examine the maps, especially older versions, look also for groins or jetties along the ocean front, a couple of which may not be connected to the land (depending on which map date you examine), the deep water channels that have to be kept dredged for larger ships in this area which is part of the New York City harbor.
| Sandy Hook, NJ |
|---|
| (7.5 x 7.5 minutes) |
| Sandy Hook is a barrier island that has formed into a sand spit. |
Flagler's Railway to The Keys
In the case of the Florida Keys, the currents travelling toward south have done the work of carrying the sediment, and are depositing it onto a series of islands strung out into the Gulf of Mexico. The sweep of their direction from the southern tip of Florida follows not only the current as it leaves the guidance of the coast, but also follows a deeper edge to the southern Florida landmass that extends downward into deeper Gulf waters.
An enterprising and wealthy businessman of the late 1800s and early 1900s, Henry Flagler, almost single-handedly created the metropolitan nucleus of Miami. He attracted rich northern folk to venture down for vacations in the area, and built a railroad to provide them with a transportation means to get there in comfort. His vision extended beyond Miami, though. At great expense and with great difficulty he built a railroad that island-hopped the Florida Keys all the way to its largest city, Key West. For the full story, follow the link at right (Wilkinson). As an indication of his significance, there is a Flagler County in Florida; for a smaller reminder you can also find the Flagler Memorial Bridge on the Palm Beach, FL quadrangle you downloaded earlier.