What is a Map?
Defining "Map"
There have been many attempts to define the word "map."
Before proceeding, take a few minutes to think about any maps you may have available to you, or that you can picture in your mind. The goal is to build a definition of "map" by identifying any words that come to mind signifying the purpose, contents or appearance of a map, without trying to compose them into a formal definition yet; random words will do. See if you can add some of your own. For example:
A what?(Describe it.) |
printed document, computer image, drawing, plan, ... |
|---|---|
Of what? |
the world, America, Pennsylvania, my town, ... |
Why?(For what purpose?) |
show streets or boundaries or places, plan new development, give directions, ... |
Including what?(What elements usually appear on maps?) |
symbols, colors, legend, scale, latitude-longitude, labels, ... |
But notice that not every map has all of these components or characteristics.
The table below contains many different kinds of maps. Each map in the table is linked to a larger picture of the map named. Examine each example; as you do, think about whether it forces you to change any of your ideas about any of the fundamental "map" concepts you listed on the previous page.
Textbook map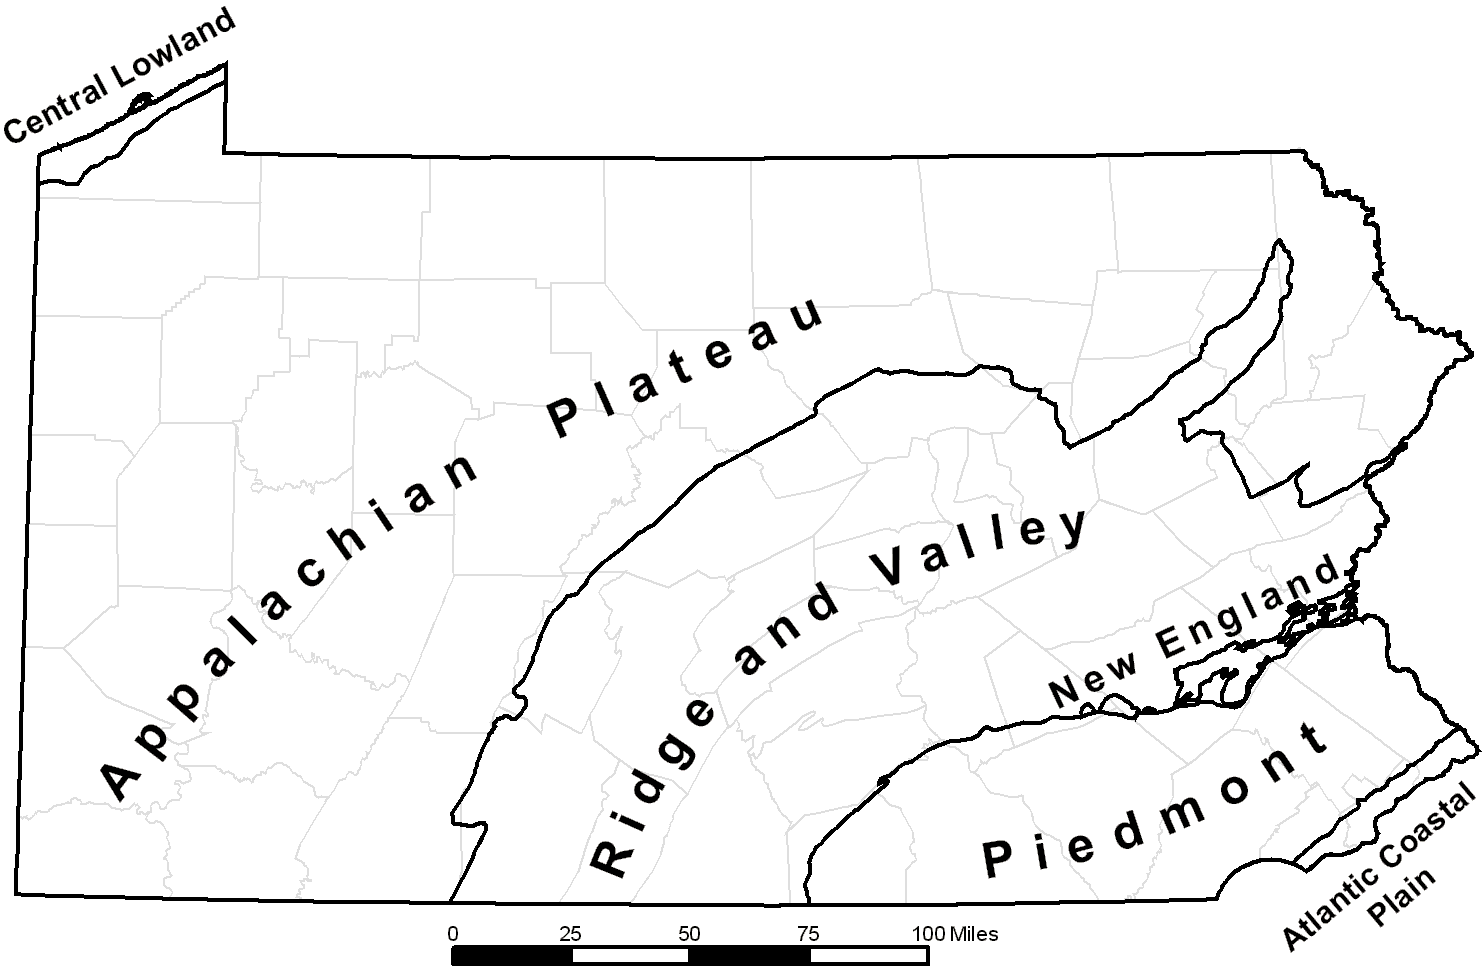
|
Highway map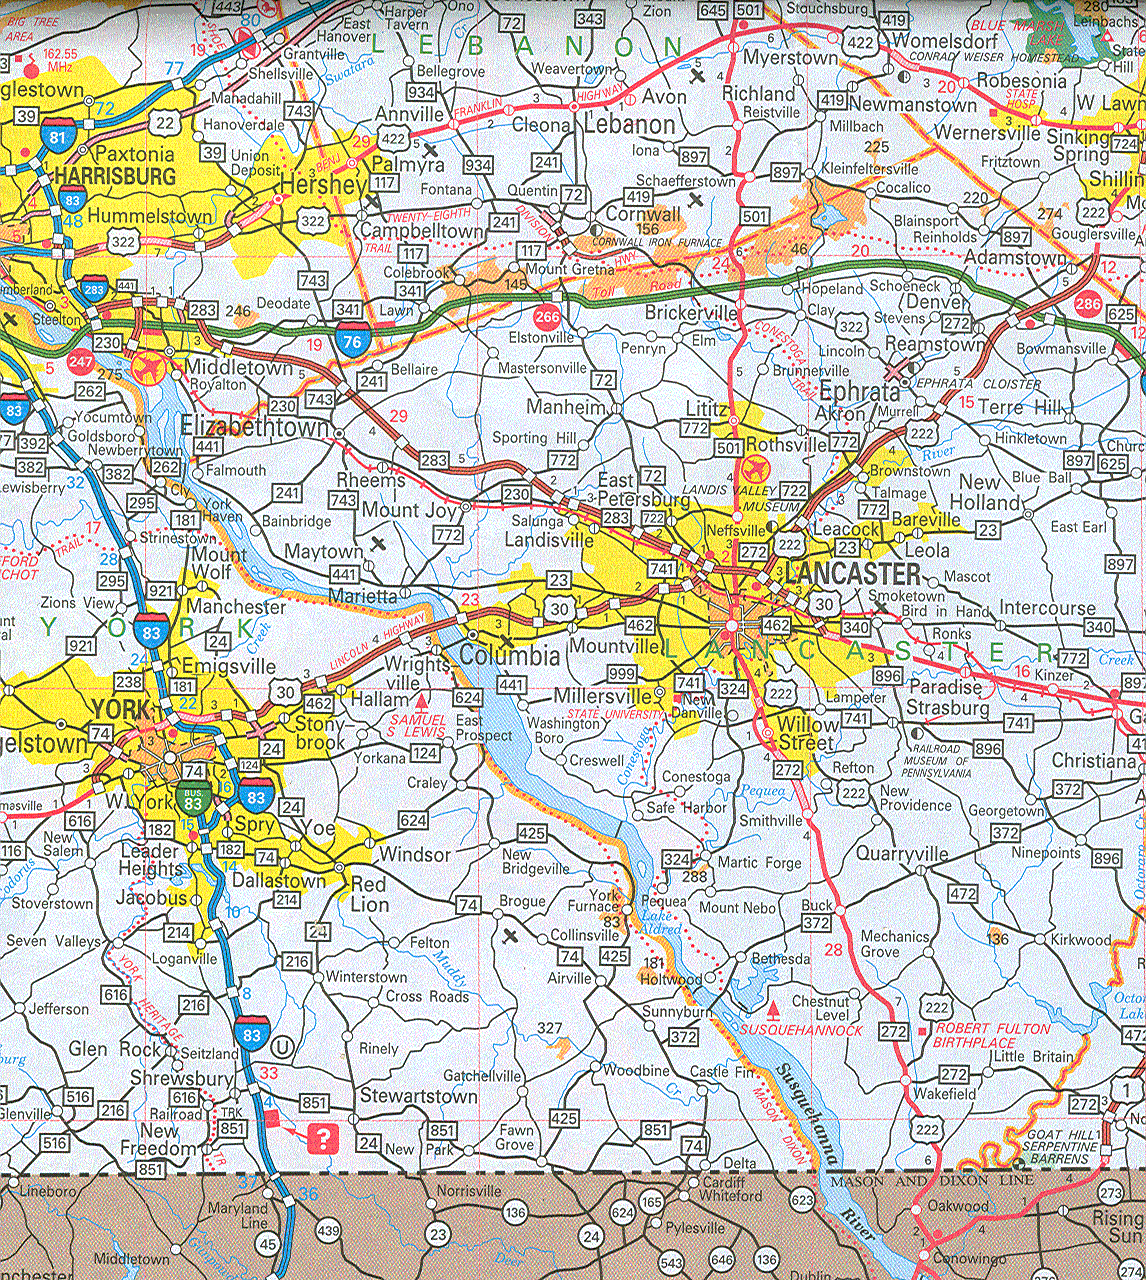
|
Land use map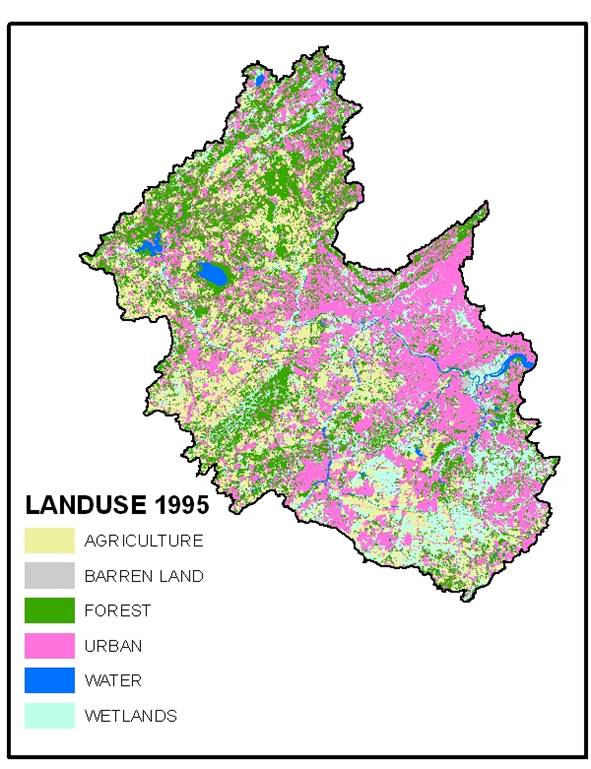
|
Soil Survey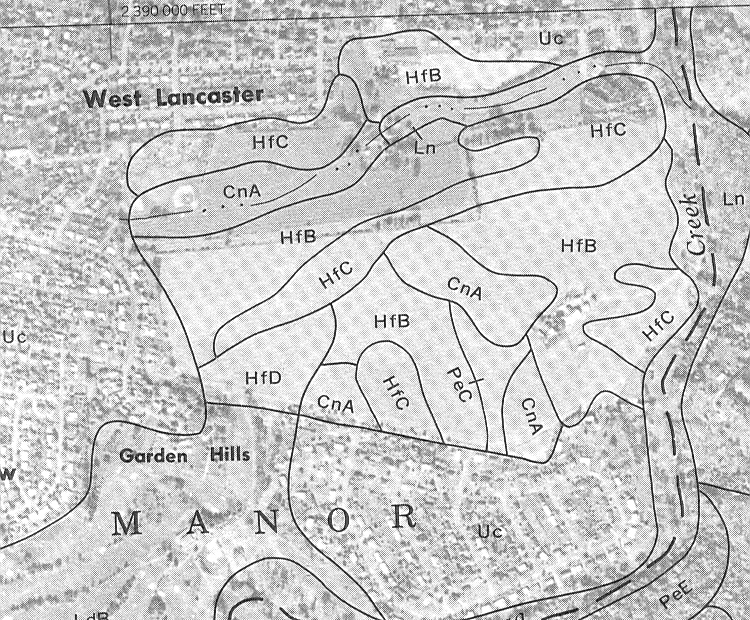
Note: Soil survey books have been replaced by the "Web Soil Survey," which can be challenging for newcomers. |
Campus Map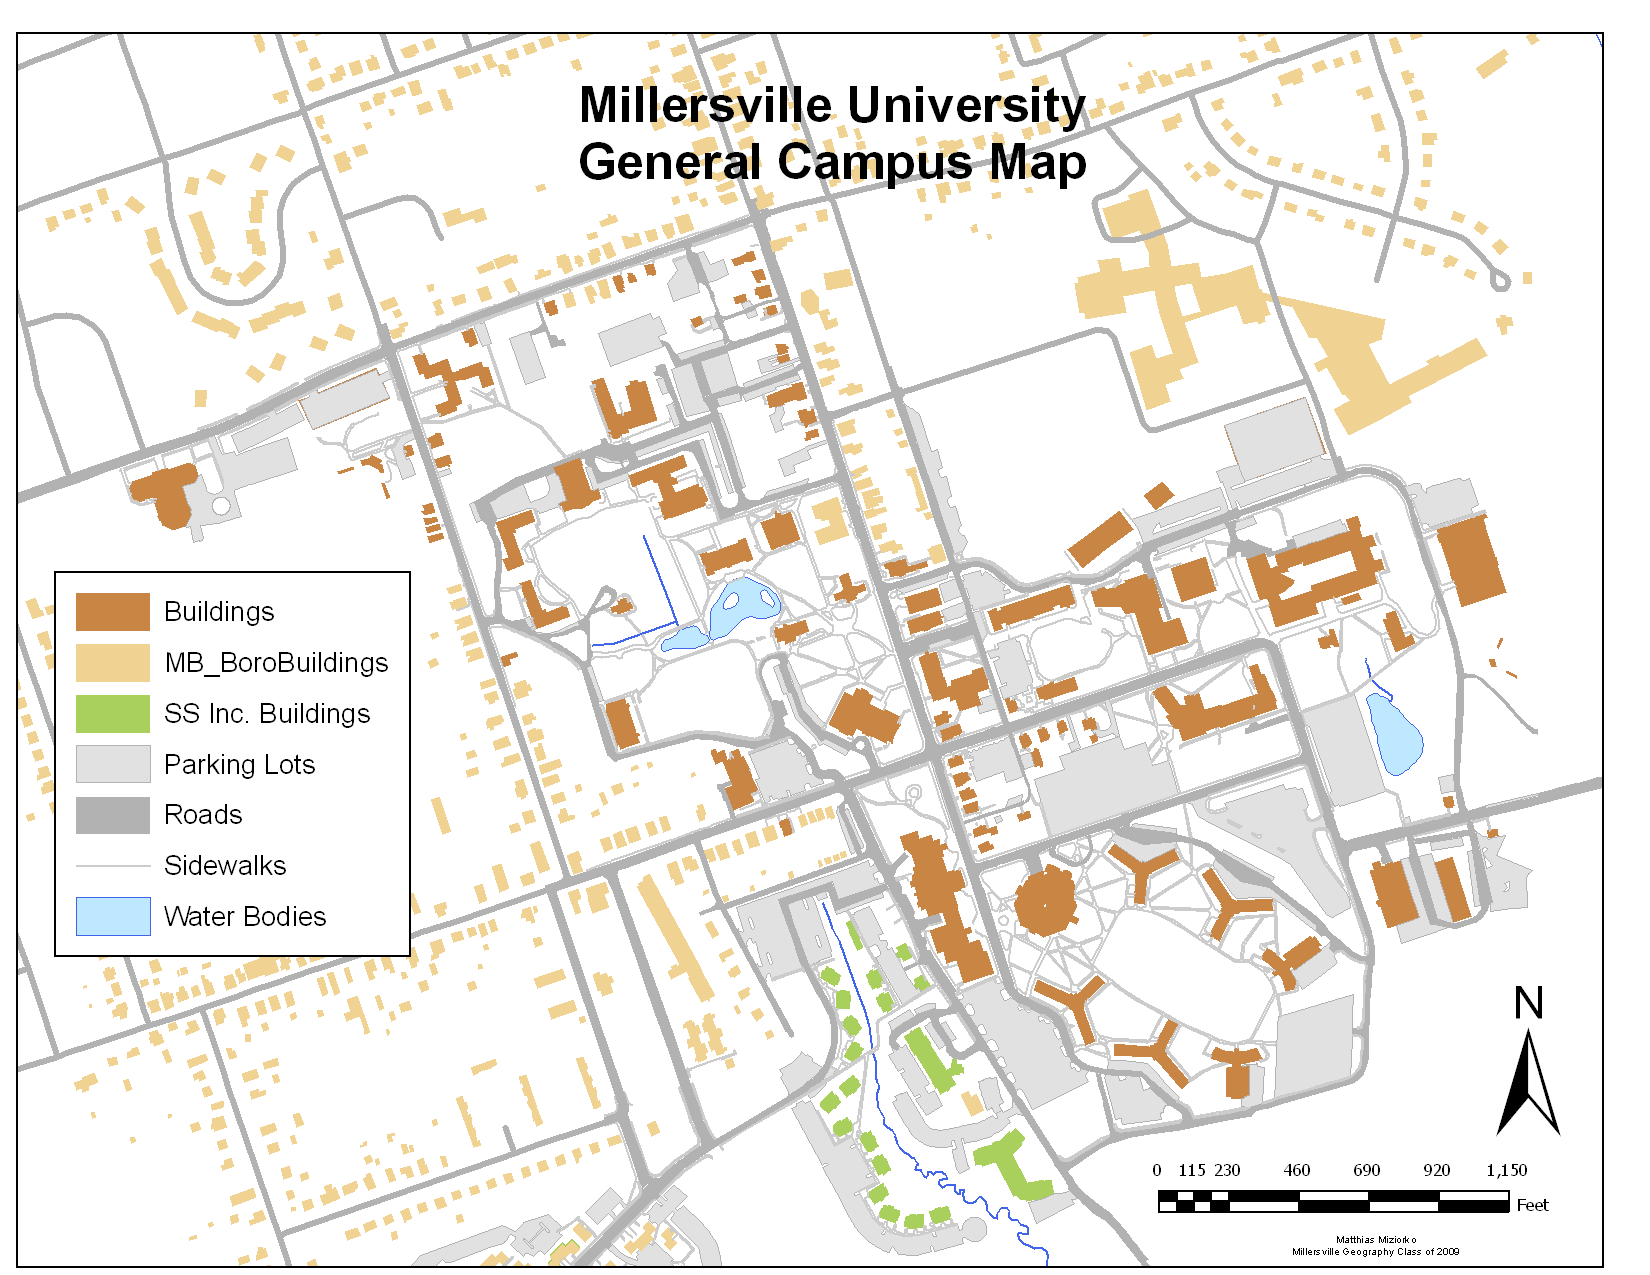
|
Aerial Photograph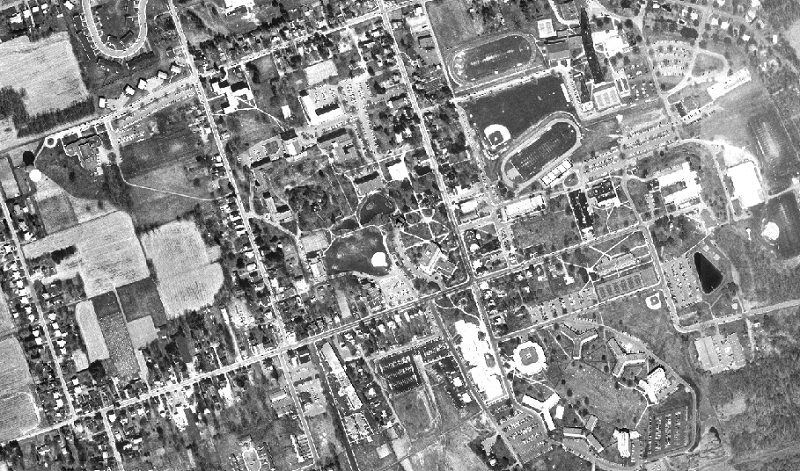
(source unknown) |
Globe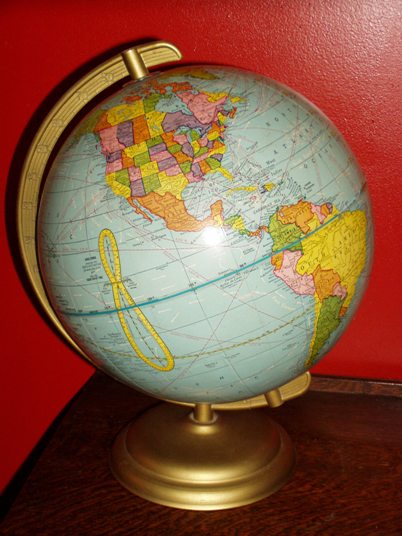
|
Topographic Map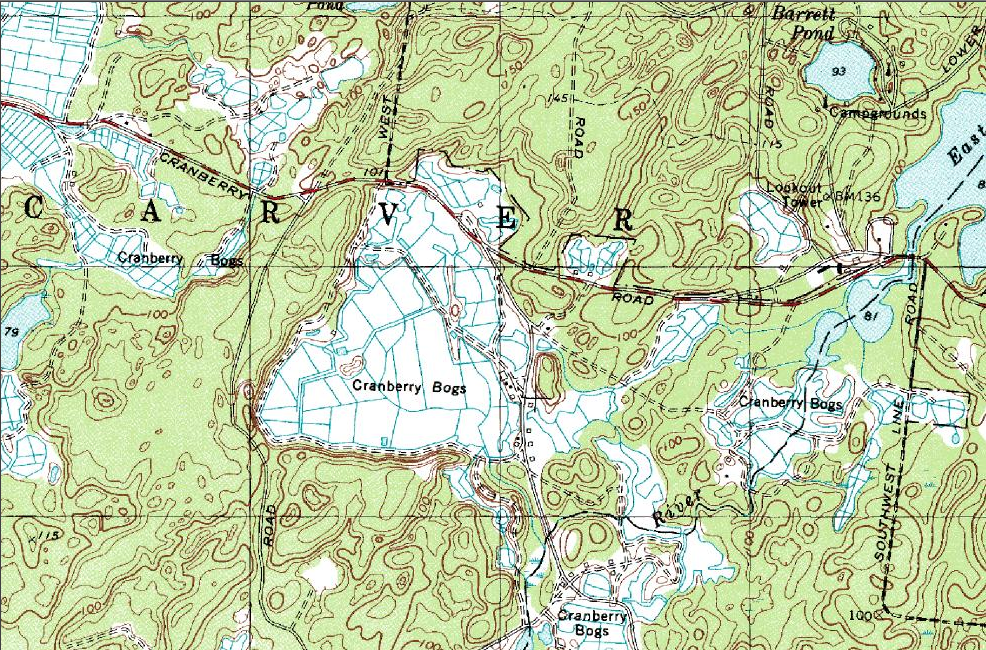
|
Moon Map
|
Census Map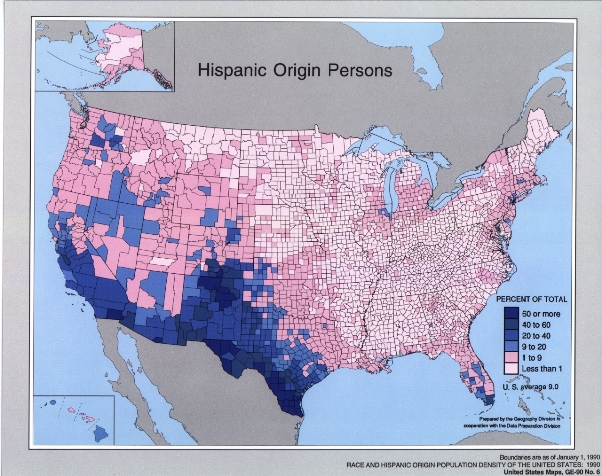
(US Census Bureau 1990) |
On-line Map
(Google) |
Hand-drawn Map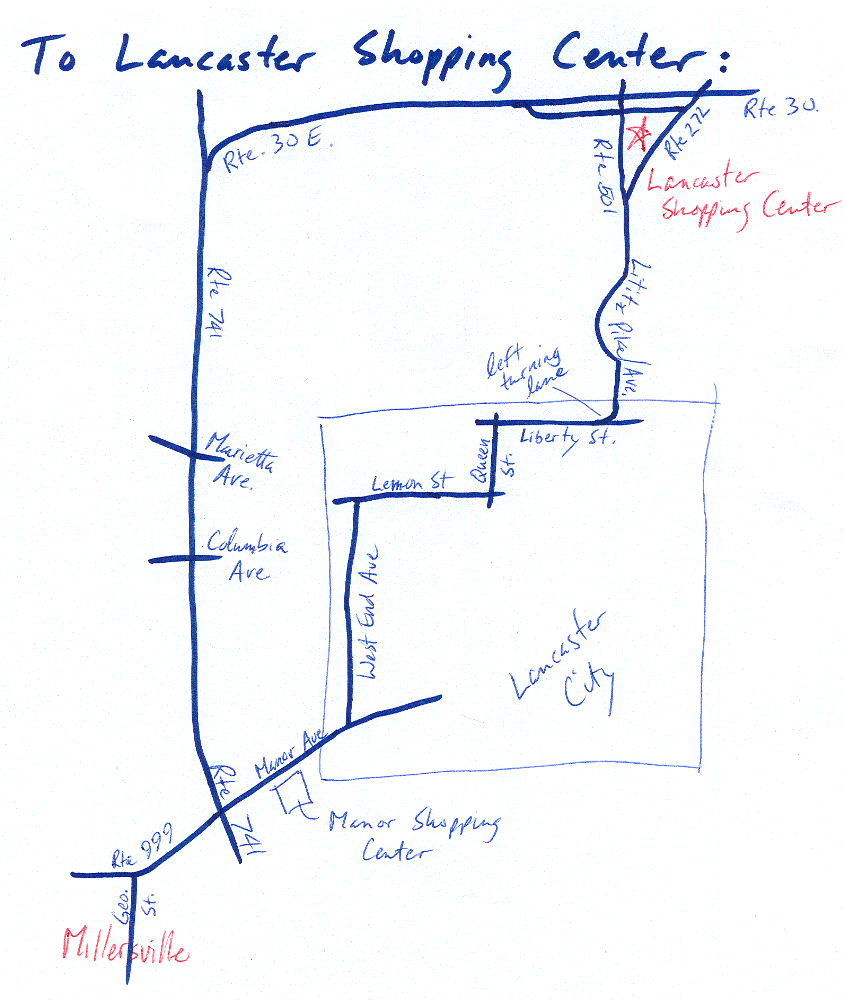
|
Also consider:
- Tourist brochure
- Satellite image
- Newspaper weather map
- Atlas
- Image of the galaxy
Definitions
Here are several definitions written by others (professional geographers, or professionals who write dictionaries or encyclopedias). How many of your random words appeared here?
"...a representation usu. on a flat surface of the whole or a part of an area." (Merriam-Webster 1999)
"...any geographical image of the environment." (Muehrcke 1986, p. 2)
"...any concrete or abstract representation of the features that occur on or near the surface of the earth or other celestial bodies," (Campbell 2001, p. 2)
Here are the definitions we will use:
As a noun: A map is a primarily graphical representation of an area, for the purpose of depicting spatial information about that area.
As a verb: To map is to collect or to represent the information content of a map.
Notice in this definition, and in the other sample definitions above, that no mention is made of scale, direction or elevation, of the Earth, or of any specific construction material or technology. Can you understand why, now?
Keep in mind that many people contribute to the mapping process. Those collecting mappable informaton include census takers, planners, the military, and all sorts of academic researchers. Those creating the maps are primarily, but not exclusively, cartographers.
An interesting twist on these meanings of the word map comes when we focus on several types of map that are fundamentally different than the traditional map printed on paper.
Globes: Is a globe a map?
If you have a narrow concept of what a map is, then you might be tempted to say, "Of course not!" You are being encouraged to broaden your thinking, though. If you apply the main concepts of our course definition, that it is a representation of an area (the world, the Earth) for a spatial purpose, then a globe clearly is a map.
Digital Maps: Is a digital map a map?
This might be more obvious because it fits traditional conceptions of what a map is, and because in today's world we are so used to using digital images in place of paper ones. The one sticking point, if you look back at the list of older definitions of the word "map," is that, when you turn your computer or GPS device off, the map ceases to exist. Geographers in the 1990s worried about such technicalities and created the category of virtual maps for those in this category and the next category below.
Mental Maps: What is a mental map?
We all have the ability to form mental maps. Our mental maps help us get around campus, drive home in the dark, and recognize the US and Canada as neighbors. Not all of our mental maps are as accurate as we would like. One of your goals in this course should be to explore the many maps, and the map resources on the Internet, that you will be presented with.
Topographic vs. Thematic Maps
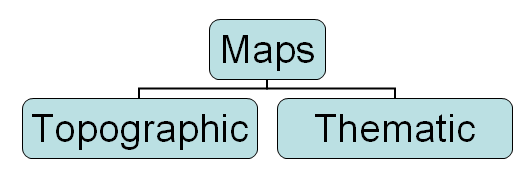
This main functional categorization of maps is based on how many types of information are depicted on the map.
Topographic Maps
Topgraphic maps combine many types of information on the same map.
For example, a USGS topographic quadrangle shows such details as roads, a variety of boundary lines, rivers and streams, landmark buildings within built-up areas, several types of vegetation, and contour lines.
The combination of types of information depicted on the map works to enable a more complete description of the mapped area. That ability to describe is still limited by the map's scale and the particular types of information shown, though; these are aspects of topographic maps that we will spend time examining.
Most of the topographic maps that we will study in this course have been published by the US Geological Survey, a federal government agency within the US Department of the Interior. We will begin to examine these in more detail below.
Another great source of topographic maps is the on-line map sites made available by Google, Microsoft's Bing and others that are paired with their Internet browser offerings.
Try typing "Millersville University, PA" into the search box of these map sites, and any others you may know, and compare the results. Convince yourself that the map views on these websites is a topographic map. Each one also has an option to switch from map view to an aerial photograph of the map area. Google calls its air photo view Earth, and includes the ability to view the scene from different perspectives. The "Bing" website has the option to switch to "Aerial" or "Bird's Eye" view to see the scene from different perspectives.
Other online sites present similar interactive maps including the next two links, "MapQuest," and "Here!".
Again, try typing "Millersville University, PA" into their search boxes and compare the results. Both of these sites also has the same option to switch from map view to an aerial photograph of the map area, which they both call "satellite" view (as Google used to call it); that is a misnomer, as all of the images used came from airplane, not satellite, sources.
The Thematic Difference
Thematic maps generally focus the map reader's attention on one primary type of information, representing one phenomenon. The idea is to simplify the map so that the spatial distribution of that phenomenon stands out clearly.
There are a half-dozen standard types of thematic maps, of which three types are presented below. All three are showing the same information: the county origins of the MU Freshmen Class of 2004. Look at these maps to understand the sense in which they simplify reality to a focused set of information. You can also see that there is not just one thematic map for showing such information. Don't worry about learning the names of the different types of thematic maps yet; you will do that in a later unit.
A Choropleth Map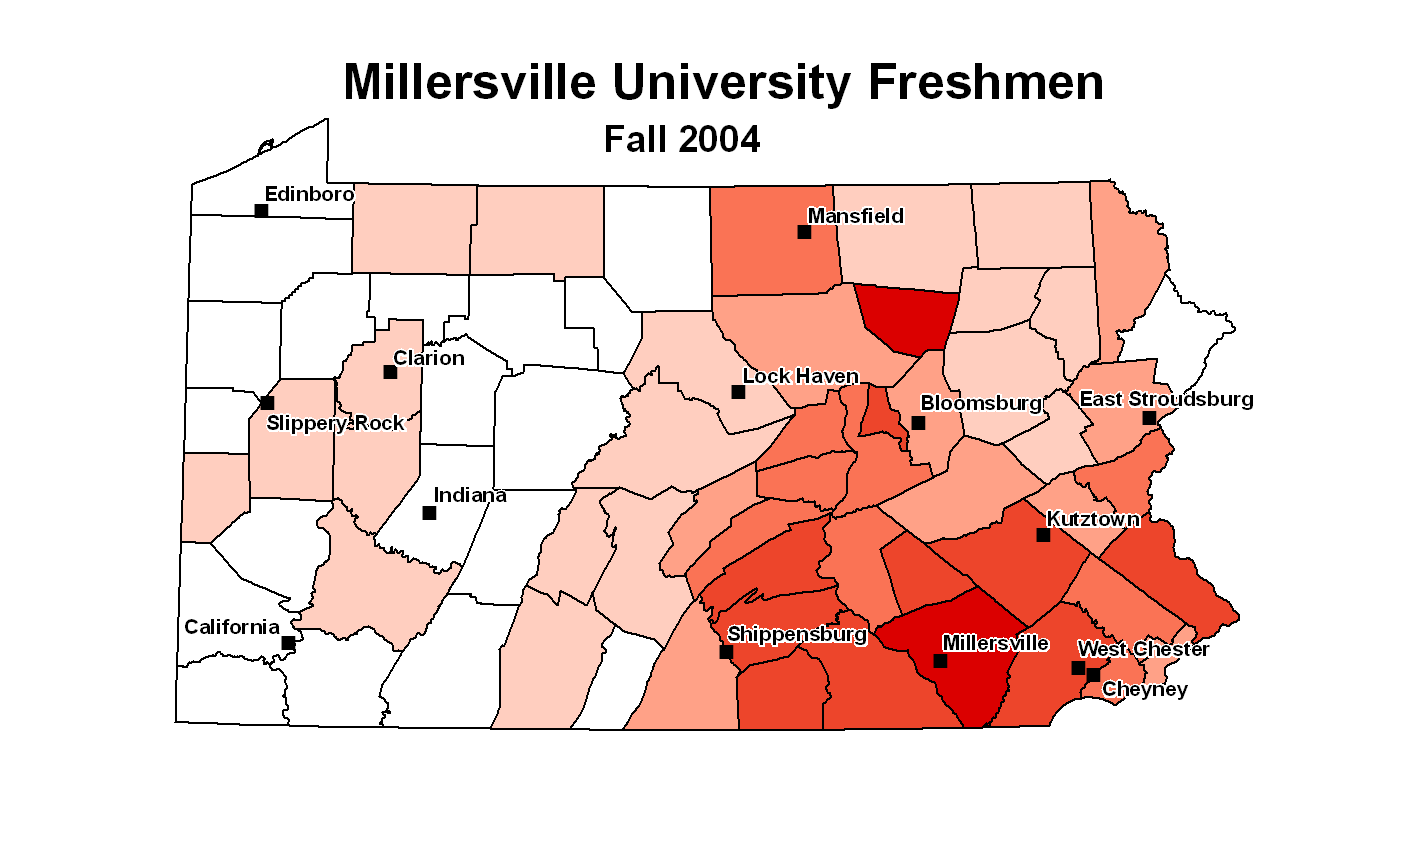 |
A Dot Map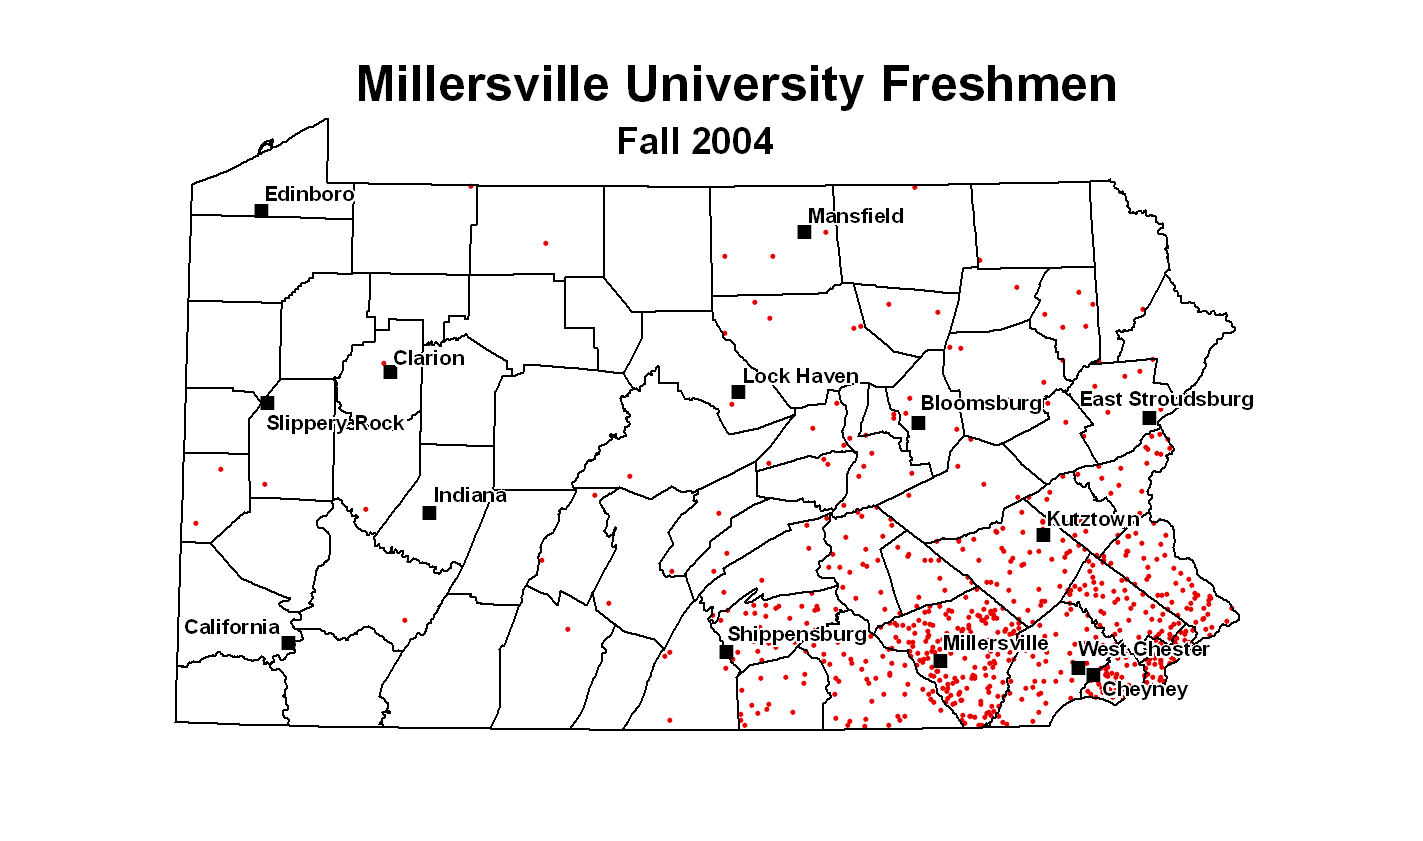 |
A Graduated Symbols Map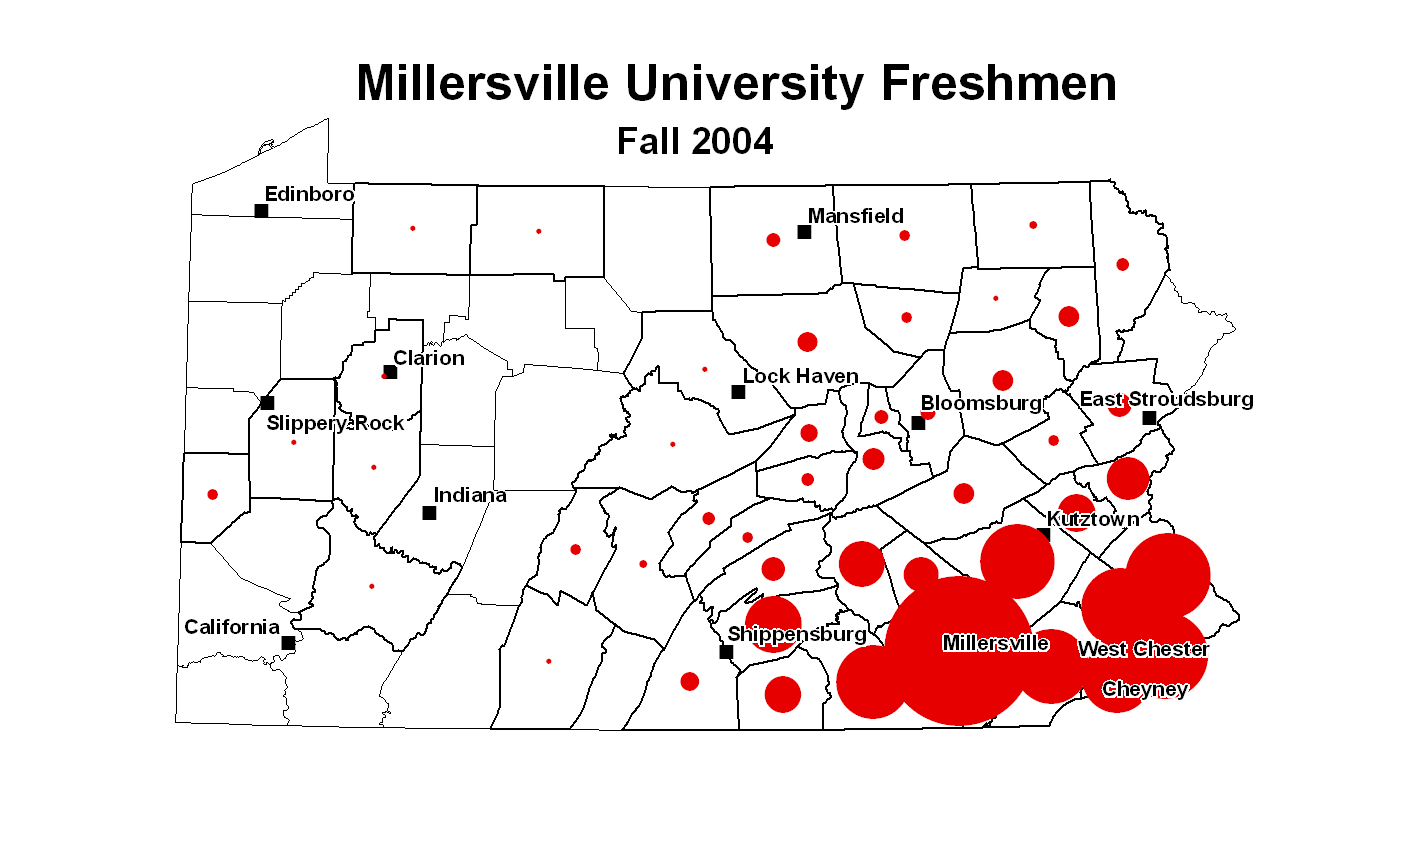 |
Who Makes Maps?
Government Agencies and Non-Profit Organizations
Who Makes Maps in the Public Sector? These professions are responsible for the maps we use every day.
The locations, points and lines that define most map features come from two primary sources: aerial reconnaissance from airplane- and satellite-mounted sources, and surveyors. Satellite imagery and air photos are analyzed by imagery interpreters who have to identify everything from crop types to exact road edges. They have technologies and techniques to remove lens distortion and angle displacement (when the plane or satellite is not directly overhead of, say, a tall building). Surveyors use equipment, measurements amd calculations to determine the most precise and accurate locations.
Many other types of map elements come from equipment that detects phenomena invisible to the naked eye, such as many different atmospheric conditions, communication signals and bank transactions. Many of them have location attributes, though.
Cartographers are the professionals who take those adjusted measurements and turn them into the precisely located points and lines that show up on maps.
United States Federal Government Mapping Agencies (alphabetically)
This is a partial listing of federal government agencies that illustrates the variety of types of information collected and mapped. Basically, every Cabinet department in the Executive Branch of the government collects data on some aspect of life in the United States, and sees the value in mapping that data. (Library, UC Davis)
- Bureau of Land Management: Cadastral Survey
- Census Bureau: census and economic data, maps and cartographic products
- Central Intelligence Agency: maps and publications
- Federal Aviation Administration: National Aeronautical Charting Office
- Federal Emergency Management Agency: flood hazard mapping
- Fish and Wildlife Service: the National Wetlands Inventory
- Forest Service: National Forest and National Grasslands maps
- National Geospatial Intelligence Agency: some publicly available products and services
- National Oceanic and Atmospheric Administration: National Geodetic Survey manages the national coordinate system
- National Oceanic and Atmospheric Administration: Office of Coast Survey for coastal nautical charts
- National Park Service: maps for visitors and also for park management
- Natural Resources Conservation Service: soils maps and data
- United States Geological Survey (USGS): topographic and geologic maps, aerial photographs
That last agency, the US Geological Survey, will be of major importance in this course. Its maps have been the primary source for regional maps for more than a century.
Add to these federal government agencies all of the state and county agencies that do comparable work at the state and county levels. For example, Educational Institutions (public and private) operate at levels of government ranging from local to federal (such as military academies) and also include schools developed and run by religious and other organizations. Just as you are reading this in order to improve your map skills and sense of location, all children need such preparation.
For-Profit Companies
Who Makes Maps in the Private Sector? The fact that cartography thrives in the private sector is evidence that there is money to be made making and using maps.
Just as location attributes make data more useful, map products have been linked with many different types of businesses.
Publishers: Books and magazines, as well as academic publications, benefit when readers are presented with the geographical context of the publications' content. One simple example, rapidly disappearing, is the traditional telephone directory.
Travel and Tourism: Just like the government agencies that want to promote travel to their tourist destinations, the organizations that benefit from such travel include automobile clubs (AAA), car manufacturers and oil (gasoline) companies, travel agencies and hotels.
Companies who specialize in deliveries and other forms of route planning: Where (literally) would companies such as UPS and Federal Express, Dominoes and Pizza Hut, florists and utilities (their meter readers, at least) be without good quality maps and employees well-educated in their use?
Environmental or Engineering Consultants: When economic cycles impose restrictions, governmental agencies at all scales, local to international, often lose some funding and have to let go workers in otherwise-permanent positions. These underfunded government agencies will turn to private companies and consultants for services they no longer have the staff to provide themselves. Mapping and planning projects are often among them. The companies that provide these services are often categorized as environmental or engineering consultants.
Several companies are especially well known for the quantity and quality of maps they have produced for a very long time:
- National Geographic
- Rand McNally
- MapQuest's descendents
While MapQuest is no longer the originator of the maps they post on-line, they were the first company to do so. Did you know that they have a Lancaster County, PA connection? The company started in the late 1960s as a division of RR Donnelley, whose primary business was printing books and other publications, including telephone directories. This Cartographic Services division began computerizing their map production in the late 1980s, and then adapting their map products for Internet use in the early 1990s. It became an independent company, GeoSystems, in 1994, changed its name to MapQuest in 1999 in recognition of its primary corporate product, and was bought by an early innovator in the computer world, AOL, in 2000 (Rosenberg, 2015). After AOL moved MapQuest's operations out of state, and then sold the cartographic operations to the on-line publisher of the "How Stuff Works" websites, former employees formed a new local cartographic services company, GeoNova, which continued to publish maps for many of Donnelley's former customers until it failed during the recent recession. MapQuest, meanwhile, reopened offices in the Lancaster area in 2011, but then closed them three years later (Mekeel, 2014).
USGS Quadrangles and Google Maps
Google Maps
Google Maps is so commonly used that you probably already have experience with it. Later in this course we will examine how its maps are created and how GPS technology works. For now, use it as an easily accessed example of topographic maps. Open Google Maps (type google.com/maps into a browser) and type "Millersville University" into its Search bar. Note that its information about the campus is limited and it is not displaying the information for use by MU students. What is missing? Who can benefit from the types of information shown in Google Maps.
To navigate Google maps, use the mouse scroll wheel to "zoom" in and out, and use the mouse cursor (click and drag) to move to different areas of the map, or "pan." Zooming can also be accomplished by using the "+" and "-" zoom buttons ![]() in the corner of the map window.
in the corner of the map window.
Google has also created a related website, Google Earth (type earth.google.com into a browser). The biggest difference is that it enables three-dimensional (3D) viewing of the Earth, even at a local scale. It is much more suited to viewing the Earth via aerial photography than traditional maps. Some of the discussion in this course will lend itself to 3D technologies, but most will focus on the traditional two-dimensional (2D) map.
USGS Maps
Most of the USGS topographic maps are properly referred to as topographic "quadrangles" because their edges are meridians and parallels. The set we will use primarily in this course are known as 7.5 minute quadrangles because each map, originally printed on paper, spans 7.5 minutes of longitude and 7.5 minutes of latitude (more detail about latitude and longitude will be provided in the next unit in this text). These maps include an impressive amount of detail, considering it takes over 30,000 of them to cover the US. Since about 2009 the USGS has converted their mapping system from one focused on updating each quadrangle individually to one in which each quadrangle is part of a national seamless digital map known as The National Map. The example below is representative of the newer maps from that series. Again, much more information about the technologies behind these (and other) maps will come later in this course.
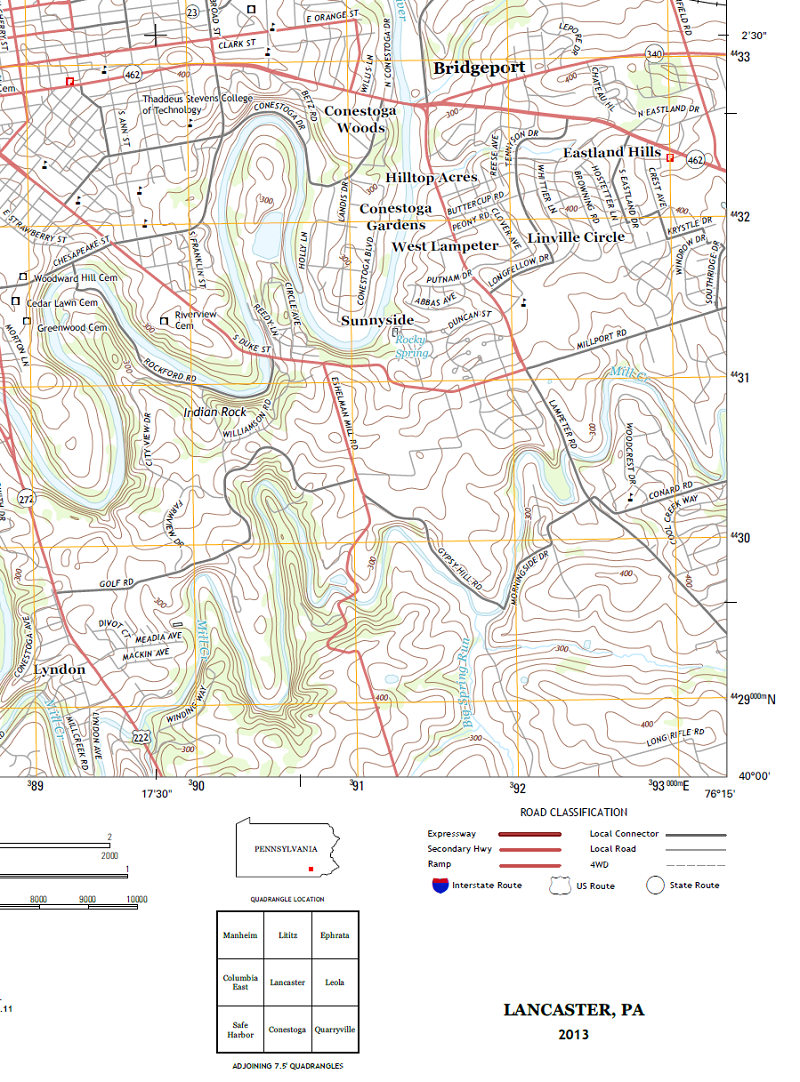
You will encounter several ways to use these USGS maps in this course. The USGS has been producing topographic quadrangles since the late 1800s, though their early maps were not produced at the same scale with the same level of detail as the more recent ones. The major revisions made by the USGS to their more recent maps include both technology changes and style changes. Initially as they moved from producing paper maps to producing digital maps and data, the USGS simply scanned copies of their traditional paper maps. The map linked below is part of a scanned paper map. It shows roughly the same area captured in the example above. However, the newer maps were designed from the start to be digital maps, best used on computers and other digital devices.
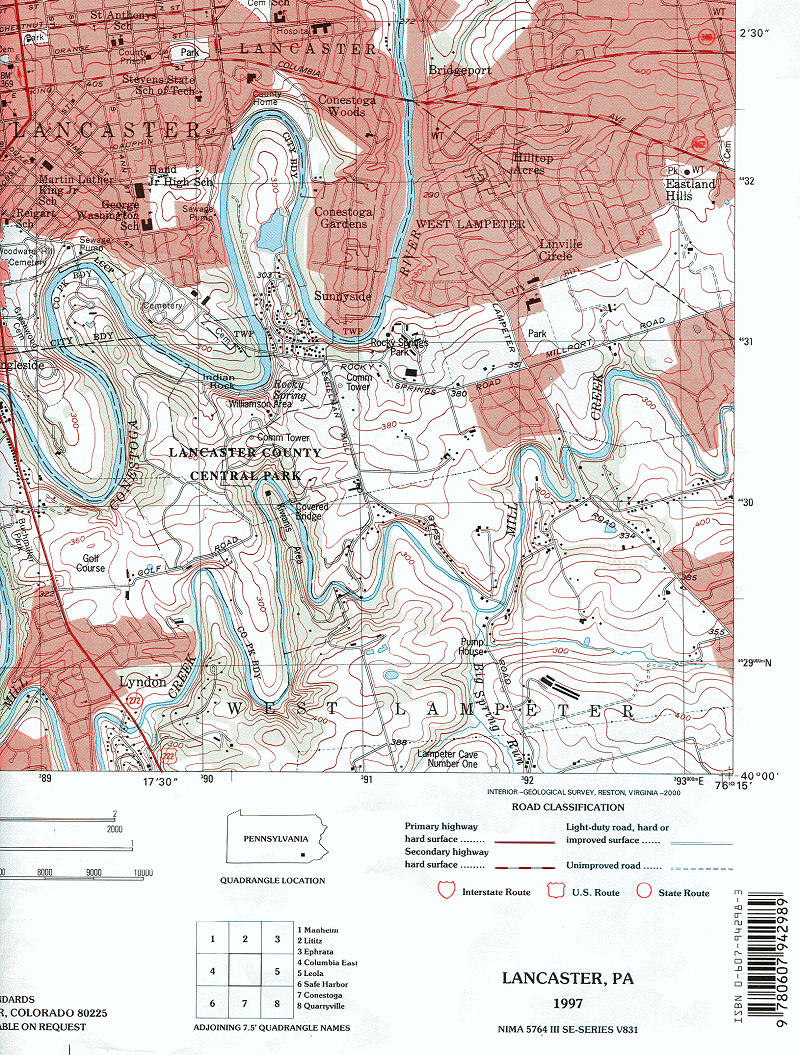
Maps such as the two above produced by the US Geological Survey (USGS) are considered to be "in the public domain" because they were produced by a federal government agency. Ownership of public domain publications (including, in this case, the data to produce them) cannot be claimed by anyone and can be used freely by anyone. The government justifies this designation because our taxes paid to the federal government have been used to fund the projects in which they were created; thus, we have already "paid" for them.
Downloading USGS Quadrangles
Going Right to the Source
It is important that you know where within the USGS website you can obtain digital versions of any of the current or historical quadrangles published by the USGS. Throughout the remainder of this course you will be asked to download dozens of these maps. For that reason, it will be highly recommended that you designate one file storage folder on your computer for saving these files so that you can easily locate any you are asked to work with.
USGS quadrangles are most commonly available as PDF files (though you will encounter other graphics file formats). The files from USGS are actually a special kind of PDF file called a Geo-PDF file, which take advantage of special "Tools" in a specific program called "Adobe Reader." The PDF files can be opened and viewed in a variety of apps, but the special tools are only present in Adobe Reader. The use of Adobe Reader and these special tools will be explained later in this course text. For now it will be sufficient to open such files with any PDF viewing software.
File sizes range from about 5 Mb for scanned historical maps, to 60 Mb each for the newest maps. The reason for the larger file sizes for the new series is that they include both aerial photography of the map area and "hill-shaded" representation of the map area's landscape (see the unit on Terrain later in this course text), in addition to the conventional map layers.
To download USGS quadrangles, start by going directly to The TopoView "Get Maps" download page.
- The body of the page is divided into a left panel, which is dominated by an interactive map, which is where you will find a Search interface toward the top and a list of quadrangles (as your search evolves) toward the bottom.
- Follow these steps to use the Search interface:
- Select "Map Name" to search using quadrangle names.
- Skip the Search bar for the moment and look at the Dates scale just below it. Move the pink dot at the left end of the scale to the right to the earliest date you are looking for. In one assignment, I ask you to download the most recent quadrangle and an older version of the same quadrangle, so this adjustment will vary according to your purpose. Keep the pink dot at the right end of the time scale at the current year.
- Just below the time scale is a series of circles representing the different map scales of USGS quadrangles. We are only using the 7.5-minute 1:24,000 scale maps (you will learn more about map scale later in this course text), which are represented by the "24K" circle. The "All" circle at the right end of that row can also be left selected, to allow you to search for either the "US Topo" map series or the "Historical Topographic Map" series (see above).
- Finally, type the name of the quadrangle you are seeking into the Search bar. Note that it will be important to include a comma and then the state (as its two-letter abbreviation). As you type more of the name, candidate maps will be listed below.
- Search results appear below the Search area.
- Above the list is a series of "Filter" circles. "Date" (the default) is probably the most useful, but note that clicking on it toggles the list between having the oldest or newest at the top. For now, stick with the newest version of the map you searched for.
- When you see the map you want in that list, click on it and that item will expand. For our purposes in this course the only thing you need to find there is the "GeoPDF" button, which will start the Download dialog for your browser. It is worth noting, however, that the GeoTiff version can be used as a map layer in ArcGIS.
- Different browsers might put the download file in different places. Make sure you note the name of the file being downloaded. Files that might arrive as ZIP files are most likely Historical Topographic Maps and are given names such as "gda_#######.zip." Instructions for unzipping ZIP files are provided elsewhere. Files that arrive as PDF files can have a wide variety of names, always ending in "..._geo.pdf" and can be opened directly by Adobe Reader.
First Use of the Quadrangles
Locate the downloaded file in your computer's file explorer and double-click to open the file using any software built into your computer. Recognize that the maps being displayed were originally published on paper. The paper sizes varied slightly depending on where in the country the map area is located, for reasons that should become apparent later. The paper sizes were approximately 22-23 inches wide by 27 inches tall (USGS). Keep that in mind as you attempt to explore the map.
The ability to pan the map in whatever program you find to open this quadrangle using your mouse (click and drag) will likely work the same as they do on Google Maps. However, controls to enable you to zoom in and out are likely to work differently. Unlike Google Maps, you cannot zoom in and out on USGS quadrangles using your mouse scroll wheel. The only way to reduce or enlarge your map is to use the tools above the middle of the map. The tools change the percentage enlargement of the map view.