ArcGIS Files
As for any computer app and the area of study it is intended to serve, there are many jargon terms to learn. For ArcGIS especially, there are many Help resources available, both within the program and from the program's makers and fellow users online. You will need to become comfortable with "the language" of GIS to be able to query and communicate with those resources.
Shapefiles
You have already learned about map "layers." A "shapefile" is a special group of data files that store one ArcGIS map layer. The term "shapefile" was poorly chosen because it makes it sound as though it is a single computer file, but in fact it is a group of at least three files and as many as fifteen files. Each file in the group has the same first part of its filename, for example "PAcounties." What makes that possible is that each file in the group has a different filename "extension" (the characters after the dot or period in the filename). For example, the following files can make up one "shapefile:"
- PAcounties.shp
- PAcounties.shx
- PAcounties.dbf
- PAcounties.sbn
- PAcounties.sbx
- PAcounties.prj
It is essential to remember that all the files in this group must be kept together in the same folder at all times. Multiple shapefiles (that is, multiple groups of shapefile data files) can be saved in the same folder.
Usually when you download data from an online source in the shapefile format, you will actually download a ZIP file, e.g., "PAcounties.zip." Make sure that you "unzip" or "extract" the ZIP file, as explained below.
Zip Files
A ZIP file is either a file or a collection of files that has been saved in a way that compresses its contents into less computer memory. The ZIP file also reduces a group of files to a single file. The usual reasons for creating zip files have to do with transferring the embedded file(s) from one computer or user to another. A file that takes less computer memory will load faster in e-mails and other data transfers. By the same token, a group of files reduced to a single file removes the risk of any of those files getting lost.
Your computer's operating system can help you manage ZIP files like it does other files. In the Windows File Explorer program, the icon for file folders is a small image of a manila folder, while the icon for a ZIP file is a manila folder with a vertical zipper on it; it is probably similar on Macs, although I have no experience with them. When a zip file is created, a ".zip" extension is added to its filename. Unfortunately, in the File Explorer app in Windows it is possible that the default setting is for filename extensions to be hidden, so you would have to rely on recognizing that icon.
Your computer's operating system also gives you the ability to "unzip" or "extract" a ZIP file, which adds a folder with a copy of the original file(s) to your computer. There are also several programs free to download that will also perform that function. Here is how to unzip a ZIP file:
- On a Windows PC: Right click on the zip file (its name or icon) in File Explorer. One of the choices near the top of the menu that opens is to "Extract all." When you select that operation a second dialog box will appear asking for location, with a default location being a newly created subfolder with the same name as the zip file. You will be able to move the folder later, but the important thing is to make a note of it now so that you can find it.
- On a Mac computer: Simply double click on the zip file in the file explorer program. This will "expand" the file into the original file or folder.
Note that the Windows 10 File Explorer allows you to double click on a ZIP file and see its file contents; this does not unzip the file for further use. This is different from the behavior that occurs on Apple/Mac computers (see above). You must realize that ArcGIS Pro cannot access the ZIP file's contents until the ZIP file is actually unzipped.
There is one more potentially confusing characteristic of ArcGIS's implementation of the shapefile. In the ArcGIS procedure to add the layer represented by the shapefile to the map, you navigate to that folder location of course. The ArcGIS Pro dialog window to add the layer will only show one of the files in the group: the one with the SHP extension.
What makes the shapefile a powerful solution to the GIS data storage challenge, however, is that GIS software generally is designed to share data between multiple maps. Two different maps of Pennsylvania, each one focused on a different aspect of the state, such as one showing the locations of its universities and another showing its state parks, can both benefit from a layer depicting the counties of Pennsylvania. Rather than each project having its own copy of the counties layer, they can both pull their data for that layer from the same shapefile. The only alteration of the counties shapefile for each map is the way the counties are symbolized (their color and outline characteristics). That symbology choice is stored as a property of the map, not as part of the shapefile, so in the universities map the counties can be shown in tan with a brown edge while in the state parks map the counties can be displayed in light green with a black edge.
The Project Document File
In ArcGIS a distinction is made between the groups of shapefile data files that contain the map layers, and the single "project document" data file that stores information about an entire project. The project will almost always include one or more maps and may contain other project elements (beyond the scope of this course). The project document data file you save records descriptions of how each map in the project is constructed, with the locations of the layer data files (shapefiles), but does not store copies of those layer files. ArcGIS Pro saves project documents as APRX files (e.g., PATopoMap.aprx). It is important to understand what the project document file is and what it saves (and does not save). For starters, the APRX file is the only data file you can double-click to start ArcGIS Pro; it will not start if you try to double-click any of the shapefile data files, not even the SHP file.
The project document does save symbology and other design decisions you made, so the next time you open the project document file the map will look the same (providing you saved it). Since saving a project document after you have added layers to the project's maps and symbolized each layer a certain way does not alter the shapefiles, you, or anyone else, can continue to use that shapefile for multiple maps in multiple projects and symbolize them differently in each one. Remember that your project document does not copy each shapefile. The most important consequence of this is that if you give someone else a copy of your project document file (by itself) to open on their computer, they will not see any content. Your project document file saves the locations of those shapefiles as they were stored on your computer, with your folder names and your folder arrangements. Someone opening that project document file on any other computer with different folder names in a different file organization structure will not be able to re-establish those locations, even if their computer has copies of the same shapefiles.
Another way of seeing this relationship between the GIS data files and the GIS project document files is to realize that GIS software also gives you the ability to edit the data files, which you will not be doing in this course as beginners. These edits are not changes to the appearance of a layer (its symbology) but to its spatial features such as line lengths, point locations or boundary alignments. If you were to edit one map layer in your map, then those edits will appear in every project document that is sharing that layer. You can imagine that there are some benefits to having the software work this way, but there are also some potential problems it could cause.
To simplify your work in ArcGIS for this course, you will not be making use of the sharing aspect of shapefiles. Our practice in this beginner's course will be to create a folder for each GIS project you work on. When you download and unzip shapefiles, be sure to save them in that project's folder before adding them as layers to your project map. Doing so will be the simplest way to get consistent, reliable results and enable you to focus on learning the program's basic operating procedures. Fortunately, this is how ArcGIS Pro works by default: ArcGIS Pro offers to create the project folder for you any time you create a new project (you should always accept that offer). The project document is the first file saved in that folder.
Basic Operations in ArcGIS
ArcGIS Usage
The best way to appreciate how GIS software works is to actually use it.
Keep in mind that creating maps using GIS software is a little bit like writing essays using word processing software. Some tasks must be done every time you start a new project, and other tasks are repeated frequently during any work session. The more often you use the software and get comfortable with repeating those tasks, the more proficient and quicker you will become and the more new features you will be able to learn.
Recall the ArcGIS software window:
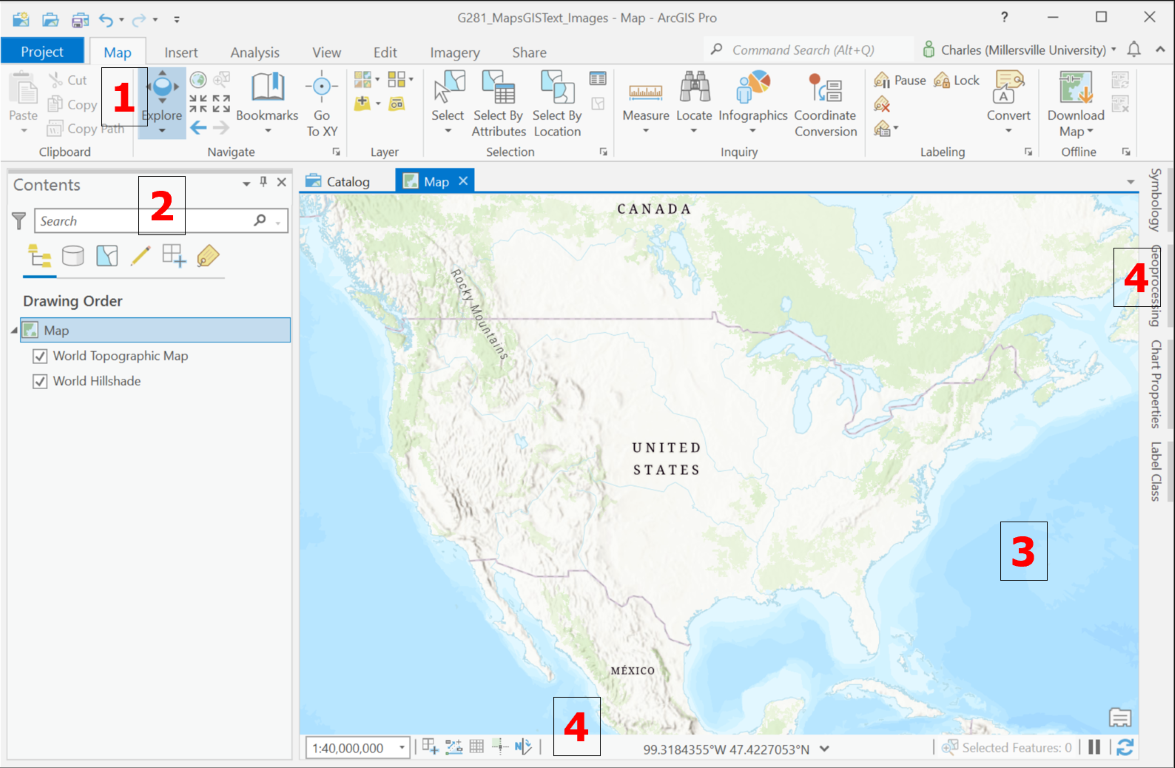
- Menus
- Contents
- Map
- Additional Commands and Tools
The "Contents" area on the left includes the heading that reads "Map" under which is the list of all the individual layers currently in the map. Each of the items in that list, both the "Map" heading and each of the layer names can be right-clicked to open a menu or double-clicked to open a "Properties" window (the Map Properties or Layer Properties window can also be opened with the last link on the right-click menu). You will work with just a few of those menu commands and property dialogs to complete map-making tasks in this course.
Here is a general workflow to follow every time you start a new ArcGIS map project.
Keep in mind that the objective here is to give you the means to create your own GIS maps using shapefile data and the ArcGIS Pro app. Please try to stick to these instructions, at least initially, because other scenarios with more complex data sources, map designs and even geographical analyses are easily encountered.
In addition to keeping your ArcGIS Pro projects folder-based and not sharing shapefiles between projects, the other simplification we will adopt is to recommend that you move your data storage to a "cloud" service such as OneDrive, Google Drive or Dropbox (there are others, too). This is especially important if you will be using ArcGIS Pro on vLab.
- First, open the ArcGIS Pro app, either from the Windows Start menu or from an existing project document file (APRX file). ArcGIS Pro is slow to open, so be patient, especially if you have a less powerful computer or are using vLab.
- If you start ArcGIS Pro from an existing APRX file, it will open directly to the map you were last working on.
- If you start ArcGIS Pro from the Start menu, you will initially be presented with the ArcGIS Pro initial window. Here there are two possibilities: you can navigate to one of your previously saved project document (APRX) files or you can start a new project. If you haven't already opened ArcGIS Pro (this will happen every time if you use vLab), you will be prompted to log in to your ArcGIS Online account, which was set up for you at the beginning of the semester. If you are starting a new project, in this course you will do so by clicking on the "Map" option.
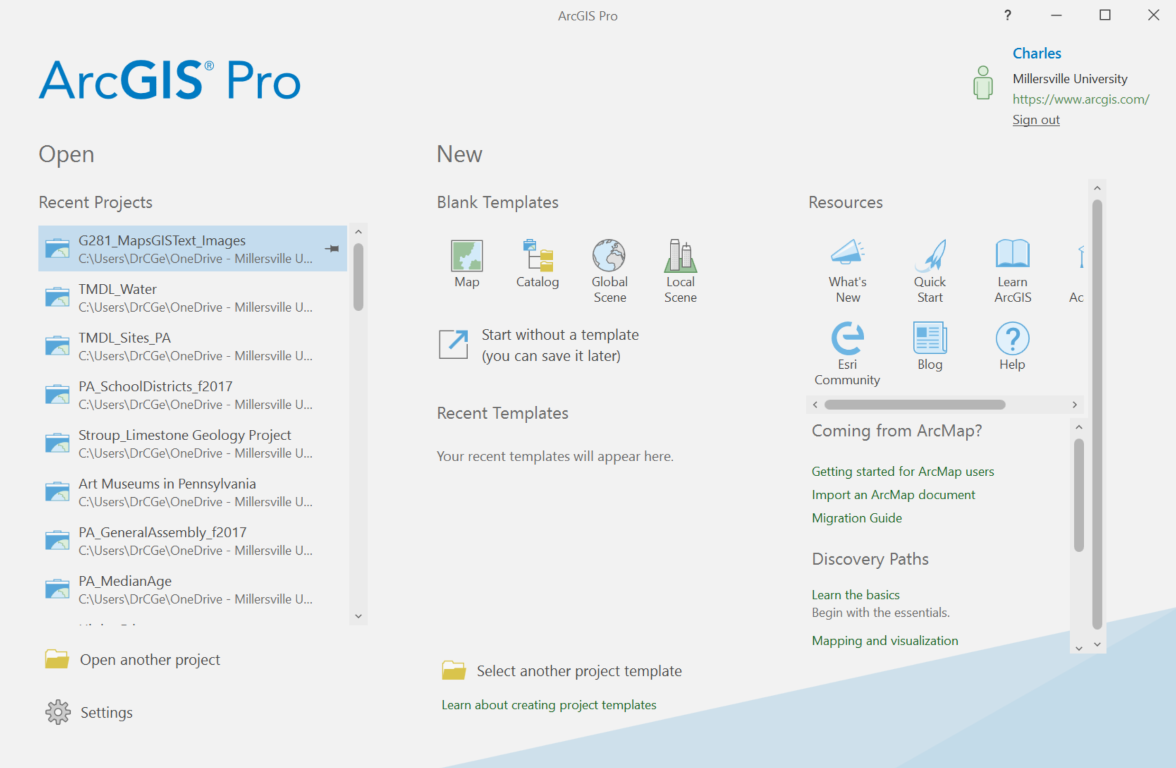
The ArcGIS Pro initial program window - Once you have an open project, you will need to know how to save your project's APRX file. The easiest Save button to access is on the Quick Access toolbar in the upper left corner of the ArcGIS Pro window. Whether it is a new or old project, it is important to re-save your work multiple times through a work session because of the hazard of losing work if the program or the computer or vLab crashes.
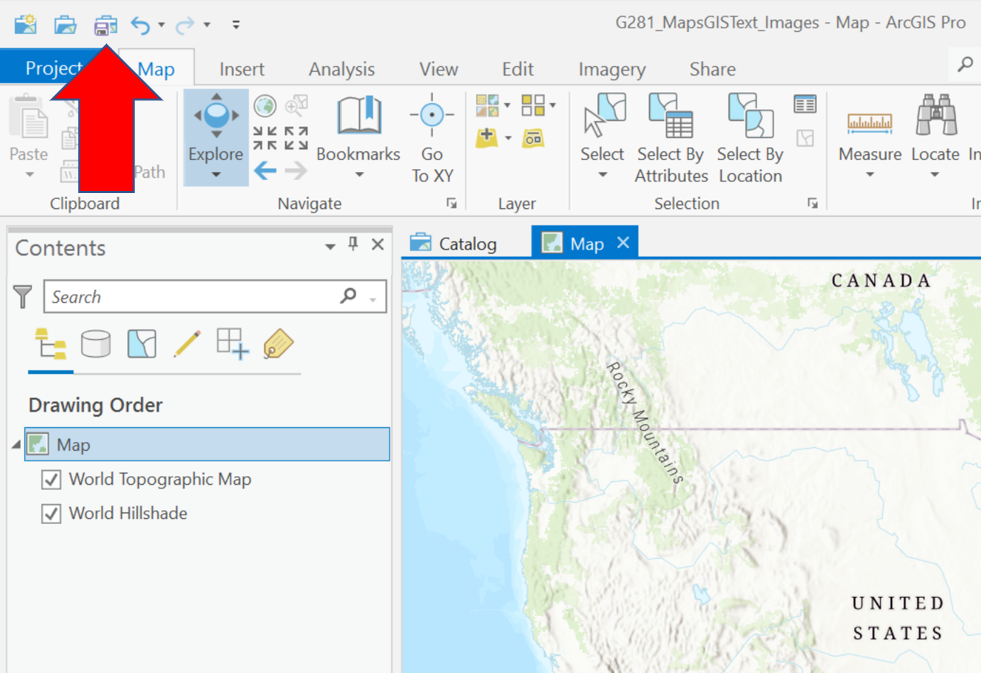
ArcGIS Pro Save Project button location
- The second step when starting a new project is to make sure your shapefiles are in the new project folder. This means that once you start ArcGIS Pro and create the new project, you must close the program and copy or move all the data files to the new project folder. Then, reopen the project in ArcGIS Pro.
- Third, you will need to "Add Data" to your map. Be sure not to use the conventional Windows "Open File" tool (which looks like a partially open file folder) for this task. "Data" in this context refers to the map layers (shapefiles). Adding data is a three-part process.
- The first part is to click on the Add Data icon on the main "Map" menu ribbon. Note that with the dynamic appearance of the menu ribbon, the button's location and appearance can change a bit. Here are two views of the Add Data button location. This opens the Add Data dialog which looks like a conventional Windows "Open File" dialog.
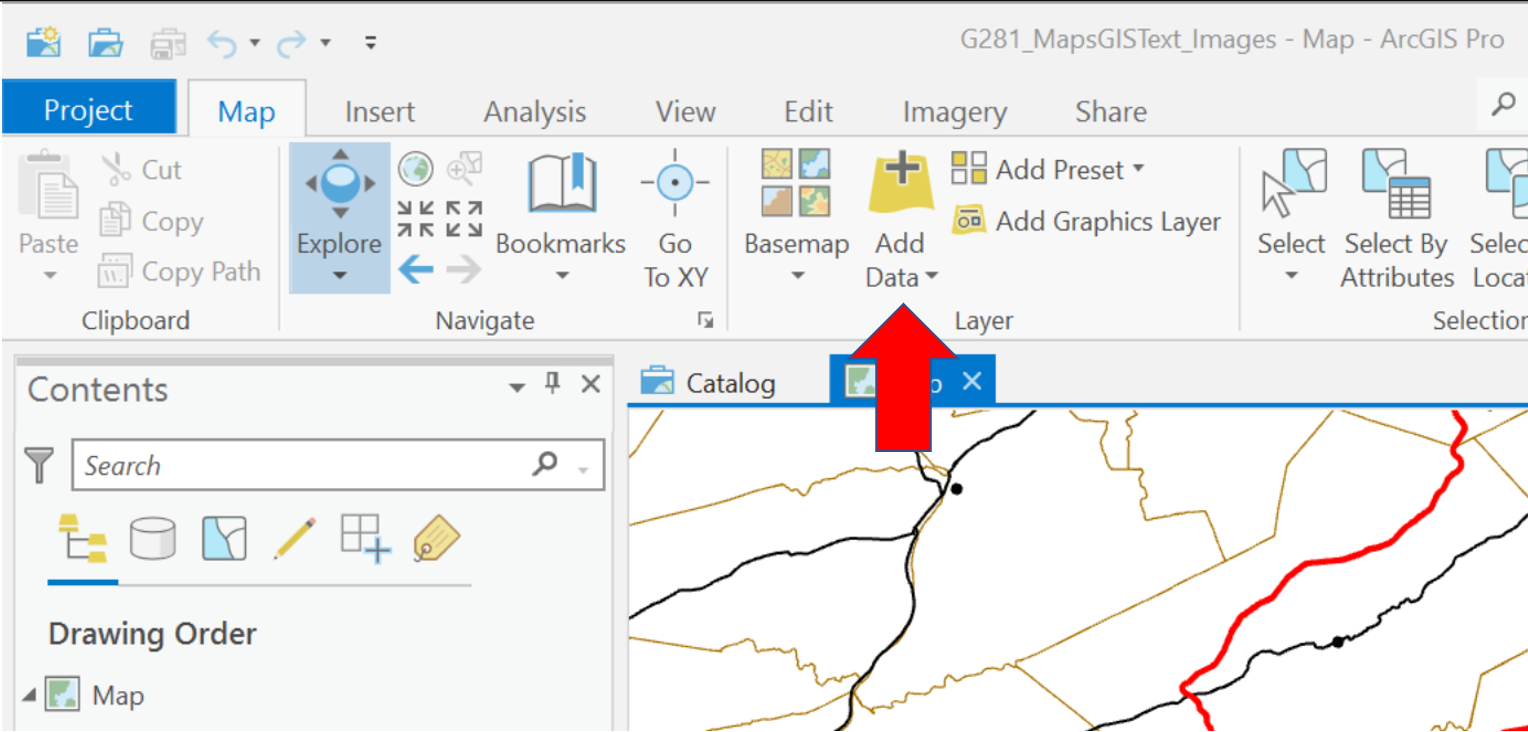
The ArcGIS Pro Add Data button location (version 1) 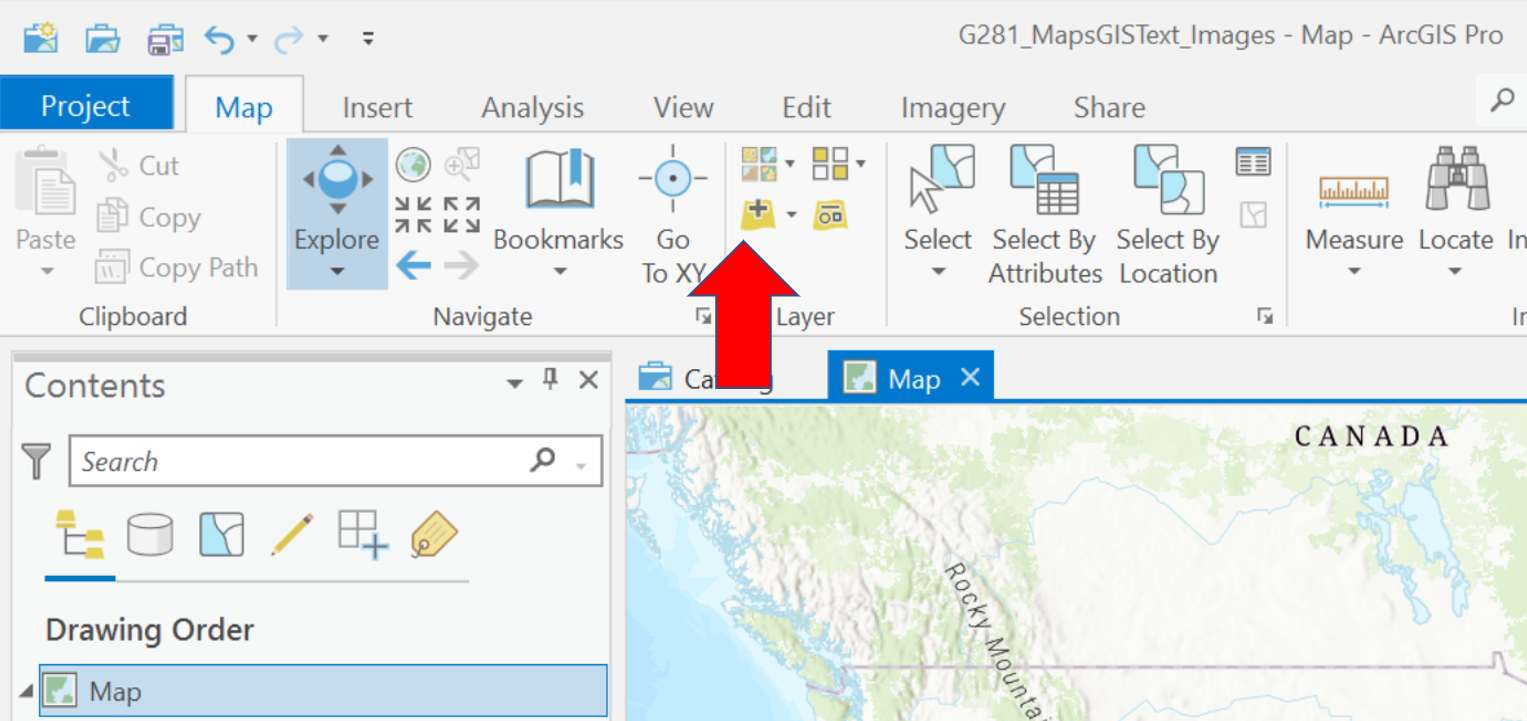
The ArcGIS Pro Add Data button location (version 2) - The second part is to open the folder containing your data. On the left side of the dialog box (below), look for the word "Folders" in the "Project" group of icons. The default folder is the project folder (the folder created by ArcGIS Pro when you created the new project; when looked at in the Windows File Explorer app it will contain the APRX file and a few other files), which is where the data should be. Open the folder to view the list of shapefiles. Keep in mind the earlier discussion that said ArcGIS Pro will not show you all the files that make up each shapefile, just the one that ends in ".shp."
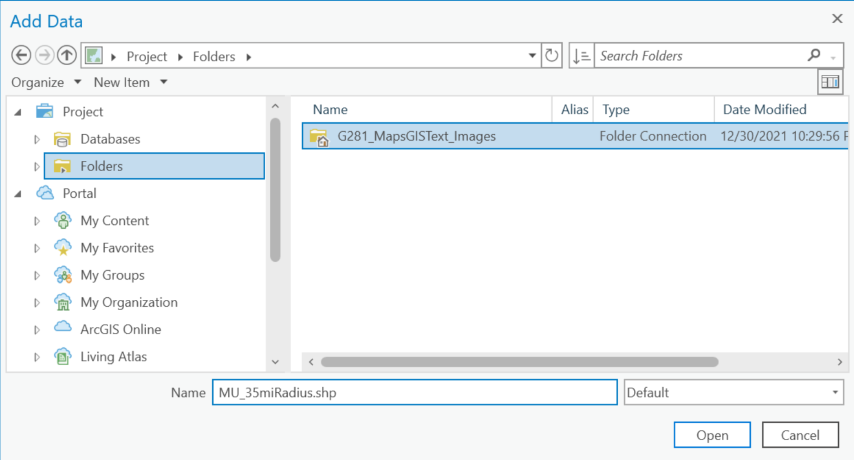
The ArcGIS Pro Add Data dialog box - The third part is to add the shapefiles to your project. Click on a single file to select it. If there are multiple files to add, select them individually using the "Ctrl" key on your keyboard or, if they are consecutive files, hold down the "Shift" key while selecting the first and last in that group. Once the file or files are selected click "OK" to add them.
- The fourth step is to organize your layers in the Contents list and symbolize each layer. Determining the order in which layers are drawn and symbolizing each layer help to determine what is visible and will control the overall appearance of your map. These controls will be described further in the next unit.
Navigate the Map
Zooming and Panning
GIS programs, like the on-line map services you looked at earlier in the course, allow users to "zoom" in to and out of a scene. This is the process of changing the scale of the map. As a standard feature in all GIS programs, it can be performed using a variety of techniques described below. The term "panning" comes from photography and movie making, and means to move the camera left or right, up or down, to see a different part of the scene. Panning in GIS simply means sliding the map in any direction to see a different part of the map area. Another way of thinking about panning in ArcGIS is that you are putting a different location at the center of the viewing area.
The primary method used to change the map scale in ArcGIS Pro is by using the mouse's scroll wheel. The primary way to pan the map is to click and hold the left button on the mouse and drag it in any direction. The importance of the mouse in both these functions is one of the primary reasons why ArcGIS is not as effective or intuitive on laptop mousepads or on tablets that have no mouse. You generally use the mouse in ArcGIS Pro in the same way you use it in Google Maps and similar online map sites.
You can do both zooming and panning simultaneously with a mouse, too. In fact, panning can be accomplished without pressing a mouse button if you move the mouse while zooming in or out. The scroll wheel zoom operation always assumes that when you switch from zooming out to zooming in (or vice versa) the second zoom operation assumes the mouse pointer is the center of zoom area.
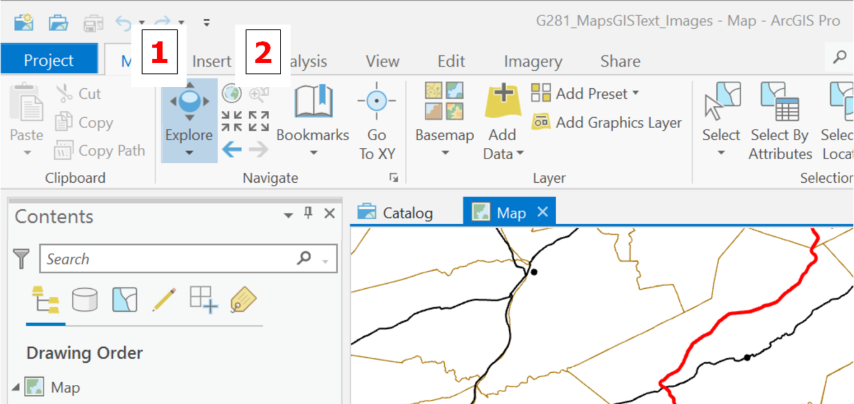
This is the default navigation behavior in ArcGIS Pro. Occasionally you might lose this behavior after performing some other functions or operations. The various tools and icons in ArcGIS Pro sometimes use mouse actions for other purposes. To return to the default navigation functionality select the Map menu ribbon and click on the Explore icon (arrow 1 below) in the Navigate group. In that same Navigate group are several additional icons (arrow 2) that have navigation capabilities. They, along with a couple other options, are explained below this map:
This list describes the additional zoom commands and tools represented by icons in the Navigate group on the Map menu ribbon. The Explore icon represents a tool, while the others just to the right of the Explore tool are less interactive: the Zoom In, Zoom Out and Full Extent commands, as well as the two zoom arrows. Two other options are hidden in the Contents area and elsewhere. You will see the uses for these later in this course.
- The Full Extent command, whose icon is shaped like the Earth, zooms the map view out to show every map feature in every layer in the list of map Contents.
- When you click on the Zoom In icon it zooms in toward your map (increasing the map scale) by fixed amounts.
- When you click on the Zoom Out icon it zooms out away from your map (decreasing the map scale) by fixed amounts.
- The Zoom arrows become functional after you have zoomed or panned your map. As soon as the map scale or map center has changed, the first arrow becomes active. Clicking on that icon returns the map's center and scale to where it just was. Once you Zoom back to a previous map scale or center, the second arrow becomes active. Clicking on this icon returns the map's center and scale to where it was before you zoomed back.
- A feature in the map Contents list allows you to select a layer, right click on the layer name, and choose a "Zoom to Layer" command. ArcGIS will zoom to the full extent of the layer you have selected.
- When you learn to "select" map features (see below) the "Zoom to Select" command zooms the map view in or out to show the full set of selected map features in all layers in the map Contents list.
Accessing Attribute Data
Features and Attribute Data
Geographical, or geospatial, analyses and decisions require the abilities to create multi-layered maps and to examine information associated with the features of each map layer. In fact, this is most likely why one of the first steps in using ArcGIS Pro is to "add data" rather than "add layers." Information in the form of data is really the heart of what GIS is all about. For each layer and its representation in an ArcGIS map, the software uses its coordinate data to draw the layer on the map, and also often uses its attribute data about the layer's features. The GIS attribute data are stored in a table structure; each row of the attribute table for that data theme is linked to one feature in that data theme. Each column in that attribute table contains a different kind of information for those map features. For example, a layer representing all the residential buildings in a community is linked to a table of information about those buildings, with each building represented by a row in the table. The attribute table can have one column recording the building addresses, another storing owners' names, a third with the number of stories in each building, a fourth with the number of square feet of floor space, etc.
Attribute data tables are integral to the functioning of GIS software, including ArcGIS Pro. Every vector map layer (showing point, line or area features) will include data stored about each feature. Some of that information can be used in spatial analyses, though that aspect is beyond the scope of this course. Some of that attribute data can be used to symbolize the layer it is attached to, which we will do when we examine thematic maps later in this course. When you acquire GIS data (as described in the previous Unit), one of the ways to assess its quality is to examine its attribute data.
Try it:
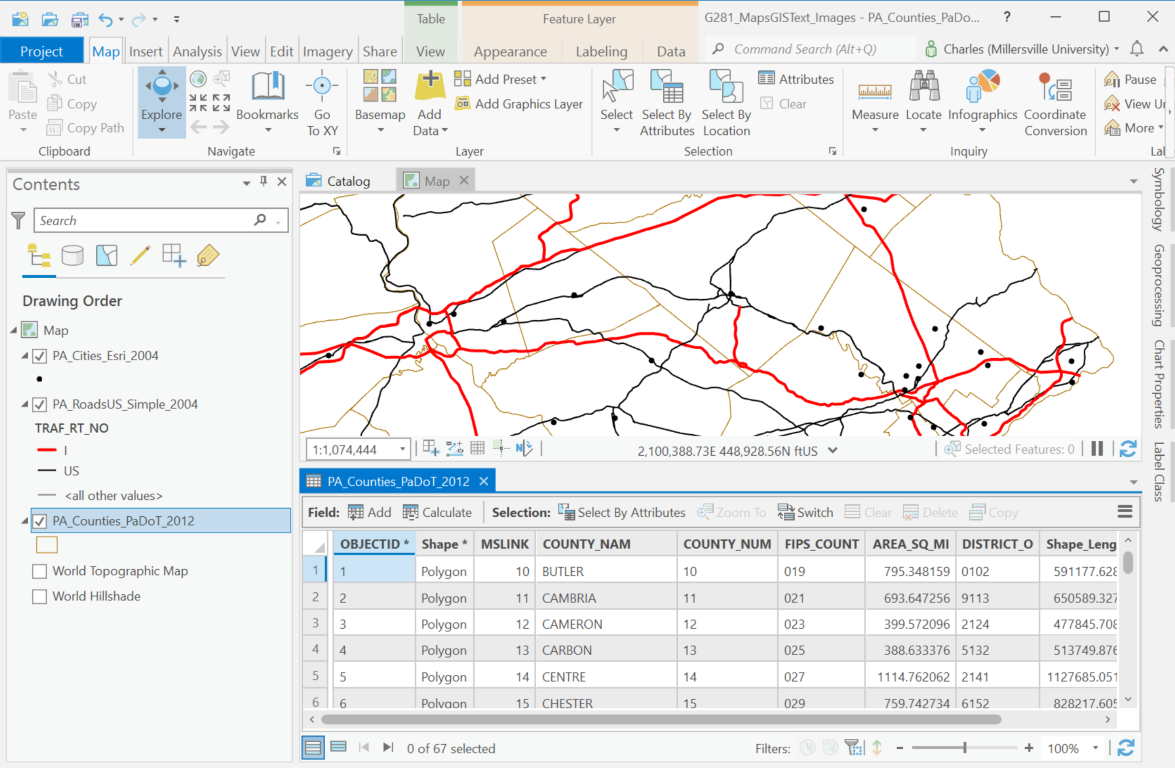
To open the attribute table for any layer, click on the layer name in the map's Contents list to select that layer. Then, right click on that layer name to open its layer menu. One of the top choices on that layer menu is "Attribute Table." See the illustration below.
The attribute table opens below the map. It is a simple table of columns and numbered rows, much like a spreadsheet app such as Excel, but with a few differences. One major difference is that every column has a heading or name instead of a letter for identification and the row of column names is not assigned a number, as it is in Excel. In fact, the columns in the ArcGIS attribute table are not even referred to as "columns" or even as "variables." Instead, they are called "fields." In ArcGIS Pro, the first fields in a layer's attribute table will always include "FID" which stands for Feature Identification, and "Shape" which will (rather repetitiously) show what kind of features are in the layer.
Data Access
GIS users have several additional ways of accessing a layer's attribute data. A simple approach allows the user to click on one feature to bring up a list of its attributes from the table. This is known as "querying" the data. A standard feature in all GIS programs, in ArcGIS Pro it is performed using the "Explore" tool on the Map menu ribbon.
Note that in the attribute table, one feature's data would be stored in one row, with one data value in each column of the table. In the pop-up window that appears when you click on the feature with the Explore tool, however, its information listing will show up in list form (vertically), each item in the list corresponding to the data table field values for that feature.
The images below demonstrate the steps to query a feature in a layer.
Try it:
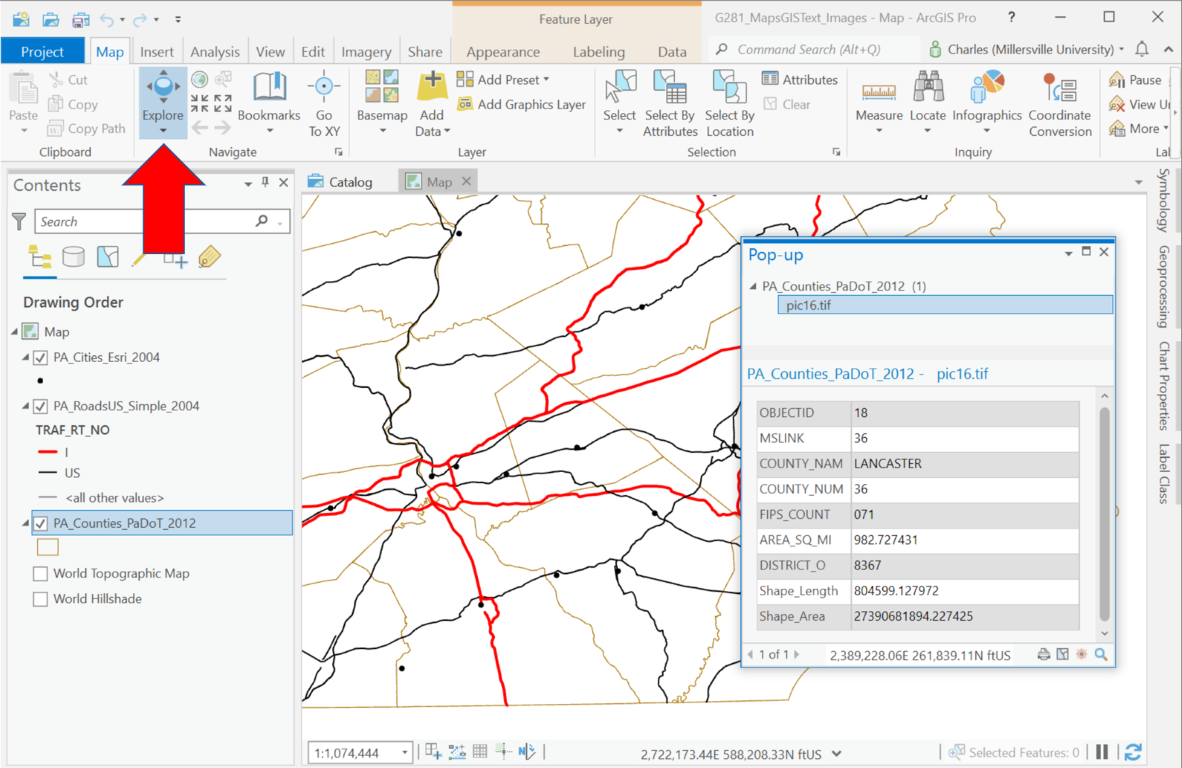
- The Explore tool icon (red arrow) in the Map menu ribbon is the default cursor tool in ArcGIS Pro, but it is sometimes not the current cursor tool if another tool has been activated; the tool icon is shaded blue as shown here when it is active. Click on the Explore tool if you need to re-activate the tool.
- Click on one of the map's features. It will briefly change color to show which feature the program thinks you clicked on, generally the feature ArcGIS finds closest to the point you clicked.
- A new smaller window titled "Pop-up" appears, displaying the attribute data for that feature.
- The trickiest aspect of using the ArcGIS Explore tool is when you have added several data themes to a map. It is not always obvious which layer's data will be listed. ArcGIS does provide two ways to highlight the selected feature again, in the lower-right corner of the pop-up window.
Feature Selection in ArcGIS
The linkage between a layer's feature locations and attribute data is GIS's defining characteristic. Once you can see the data connected to each feature on the map you have a powerful way to store information and to access it.
We can go beyond looking up data one feature at a time, though. In fact, this is another program function that resembles programs such as Word and Excel. A typical function of those programs is to "select" a string of text characters or a cell. You have already used one version of this functionality in ArcGIS Pro when you selected a map layer in the Contents list in the process of opening its attribute table. This concept can be taken further in ArcGIS Pro: you can select one or more layers in a map, one or more features in a single layer, or one or more features in multiple layers.
For example, many types of GIS analysis start with, or involve at some point, selecting a subset of the features in a layer. One type of GIS analysis is a process of eliminating candidate map features that don't meet a set of data criteria; starting with a layer of all the counties of Pennsylvania, find the one in which to locate a new store in a chain or a new regional office for a federal government agency. The focus shifts from the layer to its features; here we are looking at ways to select an individual feature or a group of features in ArcGIS Pro. Selecting a feature establishes a temporary hold on that feature and highlights it in the map and attribute table.
Feature selection in GIS has two possible ways to start. One is to start with the map and select one or more features by clicking on them. The other is to start with the attribute table and select features by selecting one or more rows of the table.
Feature selection on the map requires the use of the Select tool in the Map menu ribbon in ArcGIS Pro. Click on the tool in the menu ribbon and then click on the feature in the map. Remember: one challenging aspect of using a tool such as Select which changes the functionality of the mouse cursor is that when you want the cursor to go back to its normal functionality you must click again on the Explore icon in the Map menu ribbon. Once you learn to select a feature, an equally important task becomes "clearing" the selection (unselecting any features that have been selected). The "Clear" icon is in the same group of icons as the Select tool in the Map menu ribbon.
Single Feature Selection from the Map or Attribute Table
In the image below, a single feature (Lancaster County) was selected from the map using the Select tool. In the image shows both the map with the county's change to its border color, and the result in the attribute table. The same image can be used to demonstrate the opposite behavior.
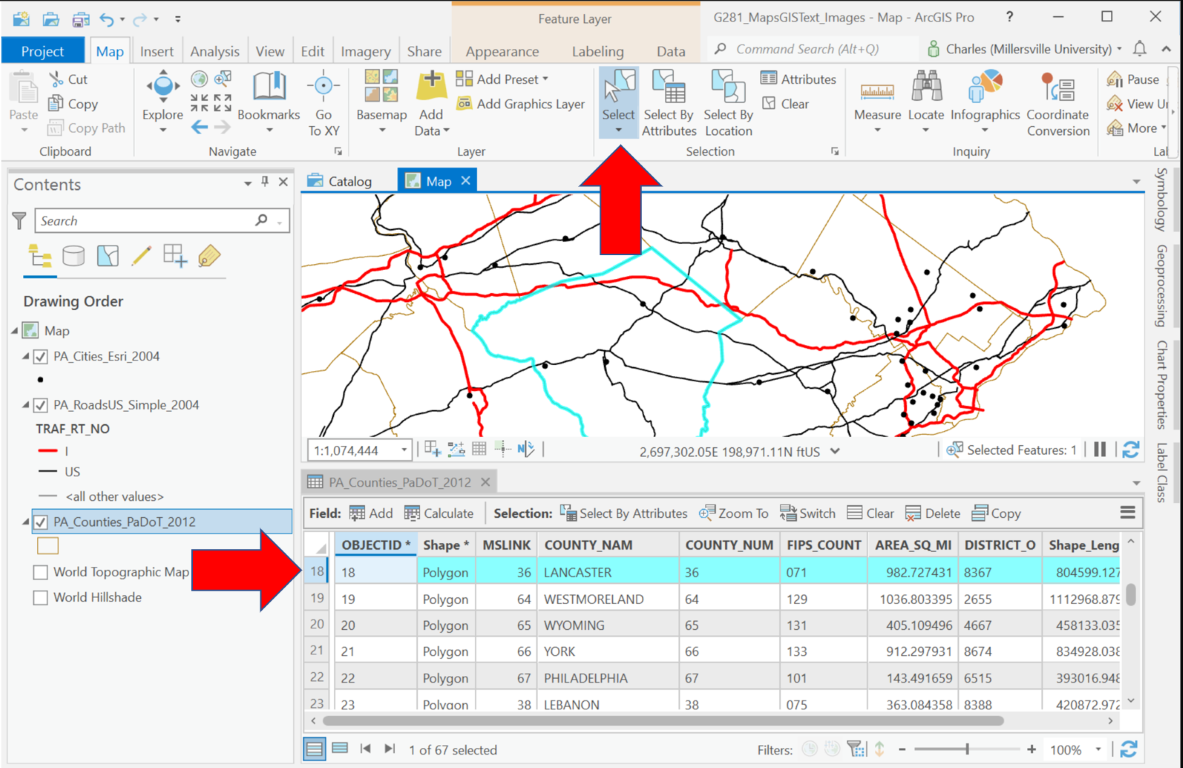
- Click on the Select Features tool (red arrow pointing up). The cursor changes appearance when you move it over the map.
- Move the cursor back over the Map and click on the desired feature. Notice that the feature gets highlighted in a different color than the rest of the features in that layer.
- View that feature's row in the Attribute Table (you may have to scroll up or down to find it); that row in the data table is given a color highlight.
To start the selection process while viewing the attribute table, click on the small, numbered rectangle at the beginning of the desired row; the entire row will be selected. It is important to note that the small rectangle (it's not really a table cell) at the beginning of the row is the only trigger available for this operation; clicking on a cell in the table does not select the entire row. When done correctly, the row is highlighted in the attribute table and so is that feature on the map.
Multiple Feature Selection from the Map
Previously, we compared selecting map features to selecting word processor text and spreadsheet cells. Like those other programs, selecting multiple features in the map view of ArcGIS can be done by using the Select tool while holding down the Shift key on your keyboard.
Another version of this procedure, working within the map, is to use the Select tool to create a rectangle (clicking on one corner and dragging to the opposite corner before releasing) that includes a desired set of features. Note that for a layer of point features the process selects every point within the rectangle, but for a layer of area or line features the process selects every feature within or touched by the rectangle, not just those inside the rectangle. All the selected features will be highlighted on the map, and all their rows of data will be highlighted in the attribute table. The tricky part of this procedure, though, is that if you have multiple layers visible on the map, all the features from all the layers within that rectangular area will be selected. That is not usually a big problem, though, since you can only view one attribute table at a time and only that layer's selected features will be highlighted in that table.
Again, this version of the ArcGIS selection procedure is illustrated below.
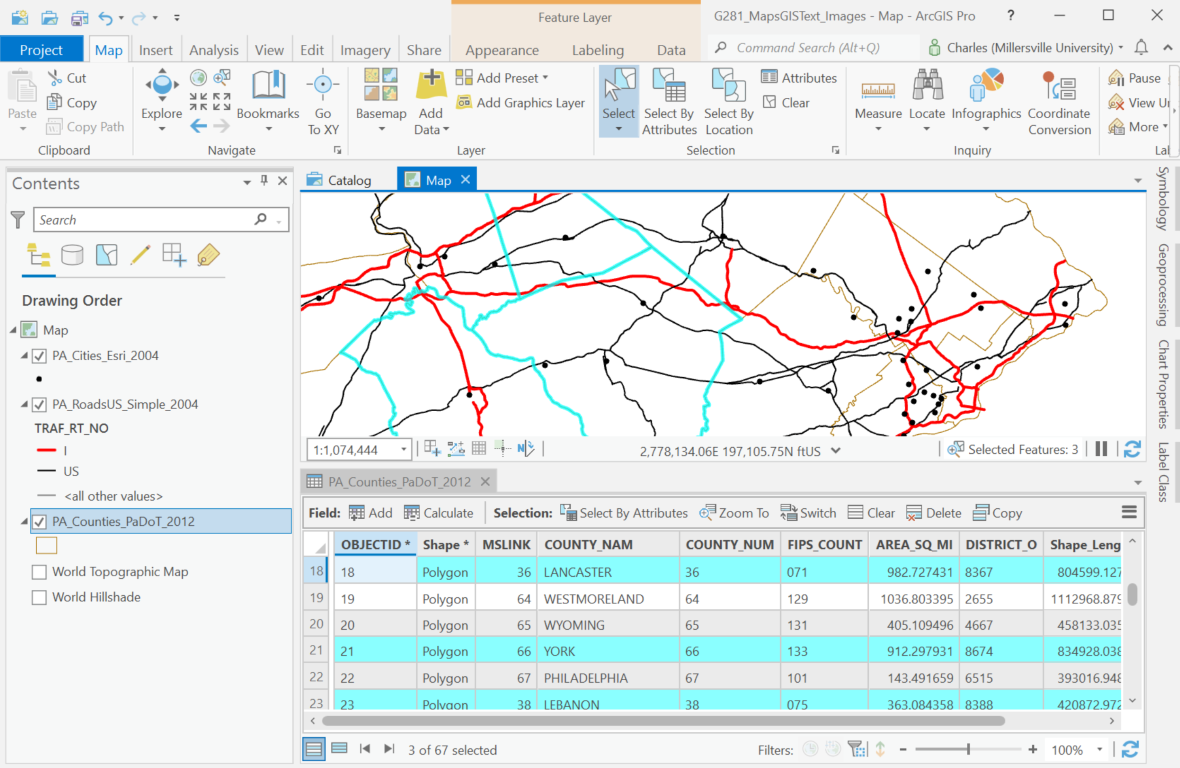
- Look for the same Select tool you used before in the toolbar above the map and click on it. The cursor changes appearance when you move it over the map.
- Move back to the Map and click on one of the features in that layer. Notice that the feature gets highlighted to show it has been selected.
- Hold the Shift key down and select another feature in that layer. Now both features should be highlighted.
- Open the attribute table for the desired layer and the selected features' rows in the data table are given a color highlight (you may have to scroll up and down to find them).
- Try usinge the Select tool to "click and drag" a box shape on the map. Look at which features have been selected, and then look at the attribute table to all of their rows highlighted.
Multiple Feature Selection from the Attribute Table
Just as we did with selecting a single feature, we can also select multiple features from the data table. Again, the key is to click on the numbered rectangle at the beginning of the row to select that row.
Once again, compare the selection process in an ArcGIS Pro attribute table with working in an Excel spreadsheet. As in Excel, you can select multiple rows by holding down the Shift key if they are consecutive, or the Ctrl key if they are scattered throughout the table. To make one type of analysis easier it is also common to rearrange the rows of the attribute table before selecting features by sorting the rows according to one of the fields; right-click on the field heading and select one of the "Sort" options.
Again, this version of the ArcGIS selection procedure is illustrated below.
- Select one of the layers in the Table of Contents by clicking on it.
- Open the attribute table for that map layer (in a new window) and click on one of the rows in the table. Notice that the row and the corresponding map feature are highlighted.
- Hold the Ctrl key or the Shift key down and select another row in the attribute table. Additional features in that layer will be highlighted in both the table and the map.
Other Kinds of Selections
The importance of the selection process is underscored by the fact that there are other ways to select features. You will not learn them in this course, but you will in the higher-level GIS course. You probably noticed their command icons in the Map menu ribbon next to the Select and Clear tools. One approach is called "Select By Location" in ArcGIS Pro and another is called "Select By Attributes." They often involve two or more different map layers, and they always involve making selections in specialized dialog boxes.
One example can occur when you have a layer of point locations (such as universities) and a layer of areas (such as counties). The selection we have already talked about here can be used to create a subset of the areas. Then the Select By Location process can be used to select all the points (universities) found within the selected areas (counties). Now the spatial relationship between two different layers becomes part of the analysis strategy.
There are many other types of spatial selection procedures, partly because there are many different combinations of the three types of geographic features, but also because GIS developers have articulated many different types of spatial relationships.