Area-Based Location Systems
Location Solutions, continued
Recall the three broad categories of solutions to the "location question," introduced in the last unit.
There, we focused on the coordinate systems as x-y coordinate (or grid) systems to locate points on Earth. This unit will focus on the other two solutions.
- Coordinate systems
- Survey systems: land partitioning (subdivision) systems
- Naming or Designating systems: assigning names or categories
These solutions point to these (in italics) specific location system options:
- The Latitude-Longitude system, a non-Euclidean coordinate system
- Locator maps or map insets
- Arbitrary grid systems added to printed maps
- The UTM grid system, a plane geometry grid system
- The State Plane Coordinate System, another plane geometry grid system
- The Metes and Bounds Survey System, a system for identifying property parcels
- The US Public Land Survey System, another system for identifying property parcels
- The governing jurisdiction hierarchy of country, state, county (or parish), and any other minor civil divisions (townships, towns, boroughs, cities, etc.), based on named areas
- Postal addressing system
- The US National Grid and its predecessors
Naming or Designating Systems: Assigning Names or Categories
The US Hierarchy of Governmental Divisions
Many dimensions of government operations depend on identifying which jurisdiction certain activities or phenomena occur in. The most straightforward of these is the hierarchy of national, state, county (or equivalent) and municipal (township, borough, town and city) divisions. If that were the basis for all government operations, it might be considered somewhat efficient. However, completely different and inconsistent boundaries are used for US and state government districts (such as the US House of Representatives districts and the completely different Pennsylvania House of Representatives districts), as well as (in Pennsylvania, at least) school districts. Any system based on names that are not in any spatial order and that must therefore be memorized before they can be used, can hardly be called systematic.
Earlier in the course, the US Census system for data organization was described. Its larger areas are the US governmental divisions, but its smaller divisions were the Census Tracts, Census Block Groups and Census Blocks. Each of the census divisions is identified by numbers, not names. As you encounter GIS layers, depending on their source, you may see those identification numbers in the layer attribute table. They are properly named FIPS (Federal Information Processing Standards) identification numbers. Part of that system includes numbers for the states, counties and municipalities as well.
The US Postal Service Addressing System
The postal system is the complex system of zip codes and street addresses used primarily as a mail delivery system. It also has great use by emergency response vehicles, and many other kinds of record keeping, including the US Census and many commercial companies (i.e., junk mail).
The postal addressing system in America (as in other countries) has evolved through many eras of population growth, mail sorting technologies and mail delivery technologies. The key to the system today is the division of the land first into political subdivisions, and (below the county level) into zip code areas (including five-digit zip codes and Zip-Plus-4 zipcodes). Even though it works well enough for delivering mail and identifying home and business locations, it would not work very well at answering other spatial questions. For example, did you realize that zip codes were assigned alphabetically, not spatially, within counties? It may help ambulance drivers and delivery trucks to know mailing addresses, with familiar road names and a logical arrangement of address numbers, but it would be very difficult to use it as a basis for storing information about the spread of air pollution and creating maps of that pollution.
The US Telephone System
This is less a locational system today than when the system was younger and under the near-monopoly control of Bell Telephone. The area codes for land-line telephones can be at least roughly mapped, and it used to be that the next three digits of your phone number (which originally were two letters and a number), referred to as your telephone exchange, also represented mapped areas with boundaries.
Survey Systems in the US
What are Survey Systems?
Survey systems divide the land into "parcels" for ownership and development.
Location systems are different from survey systems. The purpose of a location system is to enable the map user to find the coordinates of a point location. The precision of the system is a key criterion for judging the usefulness of the system.
Survey systems, on the other hand, are legal systems for recording the boundaries of properties. These records are kept in courthouses across the country, and are also printed in your property deed, which you receive when you purchase land. Surveyors use the descriptions to tell new property owners how far their land extends, or to settle property disputes.
Two survey systems will interest us in this course. We will briefly consider the Metes and Bounds survey system (below), which impacts a smaller area of the United States, but a significant portion of the US population. It is trickier to fully appreciate because it is not very "systematic." The majority of our effort will be put into understanding the US Public Land Survey System.
Metes and Bounds
The Metes and Bounds System is Not very Systematic
The Metes and Bounds "System" originated with the way the early English (in England and then in colonial America) recorded property ownership records. When the US gained its independence from Britain, it retained many British practices in the day-to-day operations of local government, and metes and bounds deed surveys, as cumbersome as their requirements are, was one of them. The property boundaries were defined by streams, trees and other landscape objects, which had to be described in the deeds. The deed description of a larger farm property can be the most complicated of such surveys, and a housing development built on a former farm only modestly simplifies such a description since its development plan must refer back to the original deed for the farm property). After the original 13 states became the USA and new states started to join the union, the federal government saw a need for a simpler and more systematic way to identify and record property surveys and deeds.
The Metes and Bounds survey system used to record property ownership in the original thirteen states of the US was the same system that had been used in England. It simply records the edges of a property as a series of straight line segments between rocks and trees (most of which no longer exist), using directions and distances to complete the descriptions, and twisting segments following roads and streams (many of which have changed course somewhat).
Since early landowners were likely to be farmers with many acres of land, some of the descriptions ran very long. In modern times, in those same states, many farms have been subdivided by developers who gave their properties simple shapes, much more easily described. Still, it provides great job security for surveyors who have the ability to interpret the old deeds that still pertain. The description linked below (Surveyors Historical Society) includes a sample map that might have accompanied an early Metes and Bounds property survey of a farm.

The US Public Land Survey System
The US Public Land Survey System (PLSS) was the solution to the massive task of surveying hundreds of thousands of square miles of government-owned land in order to sell it to private land owners. From a dozen or more starting points, square areas of land that measured six miles east-to-west and six miles north-to-south were surveyed and subsequently many of them were subdivided into smaller rectangular units suitable for farms and ranches, towns, and other uses. The impact of that grid of property owners has left a patchwork appearance on the western landscape that is still easily observed in aerial photographs today.
The best way to put the information below to use is to observe it on a USGS quadrangle. As you will learn below, only certain parts of the US use the PLSS, so the first requirement is that your map must be in that area. Once the quadrangle is open in Adobe Reader and the Layers list expanded, look for two layers: First, find the "Projection and Grids" layer and turn it off. The reason for doing this is to avoid having too many grids visible at the same time. The second layer to locate, which will be turned off initially, is the "PLSS" layer. Once the Projection and Grids layer is off, turn the PLSS layer on. The grid lines will be added in red, although they might not be visible in all areas of the map if they line up with roads or other features (which happens frequently), as will the labels (also in red) that are an important part of the system.
US Public Lands
When the US began settling land west of the original thirteen states and then made the Louisiana Purchase, the federal government got into the business of owning land and selling land parcels to citizens. It started out as a way to avoid raising taxes in order to pay off debt incurred to fight the Revolutionary War. Faced with the prospect of surveying every eventual property, the government tasked Thomas Jefferson with coming up with a more systematic solution.
That solution was the US Public Land Survey System, or PLSS. It is most easily described as a series of nested land divisions, each level subdividing the previous level according to a uniform system. At its highest level, the government divided the land into territories, which later became groups of states. In each territory they established a single Principle Meridian, which became a common north-south edge for the next level of land subdivisions. They also established a single Base Line, which was a parallel that served the same purpose in an east-west direction. See the map below.
Notice that a few states outside of the original thirteen states do not use the PLSS. Most of them became states within a decade or so of the founding of our country, or became a state when an original state was divided (West Virginia). Texas, on the other hand, had existed in other circumstances before becoming a state of the US, and so had already established a land survey system.
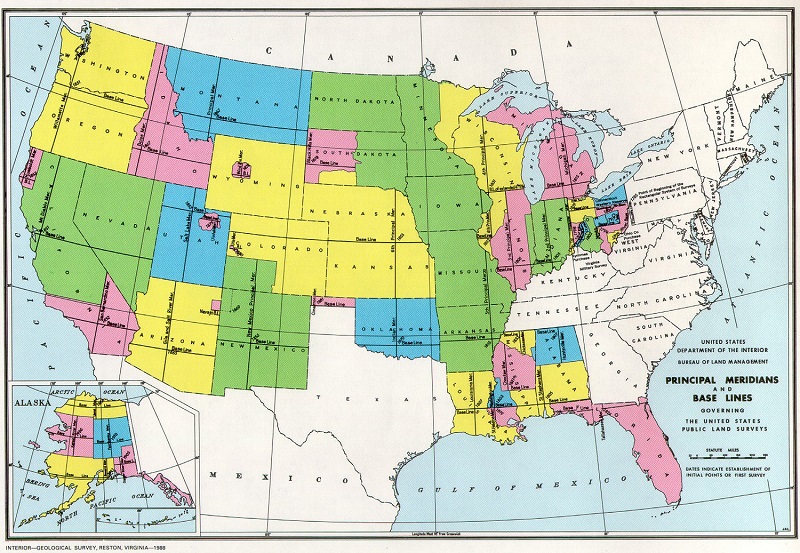
The US government agency responsible for maintaining information about the PLSS is the Bureau of Land Management, within the US Department of Interior. The lands were originally the property of the US government (there are some areas that still are) and it was the federal government that laid out the original PLSS property lines.
PLSS Survey Townships
At the next level of the system, each territory was divided into Survey Townships, in some territories there are thousands of them. Every Survey Township is approximately the same size, 6 miles north-south by 6 miles east-west. The sizes have to vary because of the curvature of the Earth; it is not possible to maintain a rectangular grid over the sizes of many of the territories. The Survey Townships are arranged in rows and columns east and west of the Principle Meridian, and north and south of the Base Line for that territory.
The survey townships are not named, and they do not serve as units of government. They are identified by a system of numbers and letters which basically count how many tiers (the rows) and ranges (the columns) of survey townships there are. The diagram below illustrates the system. The "R" identifies which range that survey township is in. "E" or "W" follows the number to show whether the ranges are east or west of the Principle Meridian. The "T" identifies which tier that survey township is in; many say that it stands for township and refer to the PLSS as the Township and Range system. "N" or "S" follows the number to show whether the ranges are north or south of the Base Line. The shaded township in the diagram is T3N R2E.
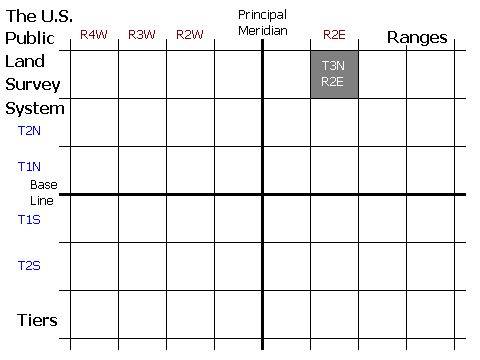
Later, when you are using USGS quadrangle maps for various purposes, you will see how PLSS system townships are identified. Survey townships are generally bigger than the area of a single 1:24,000 topographic quadrangle. They are identified on the maps in the margin on the older style quadrangle maps (before 2010); on the newer digital quadrangles, the townships are labeled within the township on the map itself. In the left and right margin you will see the tier identified, and in the top and bottom margin you will see the range identified.
PLSS Sections
Each PLSS survey township is divided into 1 mile by 1 mile Sections. Since the survey townships are 6 miles by 6 miles in dimension, there are 36 sections in each one.
Once again, the sections are not named but are identified by number, 1 to 36. In every survey township in the entire country, the same numbering pattern is used, and it is a rather quirky pattern, as illustrated below. These numbers appear, usually in red, in the center of each section, and the section boundaries are usually shown in red also, on both older and newer USGS quadrangles. In this diagram, the Survey Township boundaries are shown as red lines. The darker numbers show the Section numbers, while the lighter numbers show Section numbers of the surrounding Survey Townships. Notice the jump in the values of the Section numbers as you proceed across a tier and change from Township to the next.
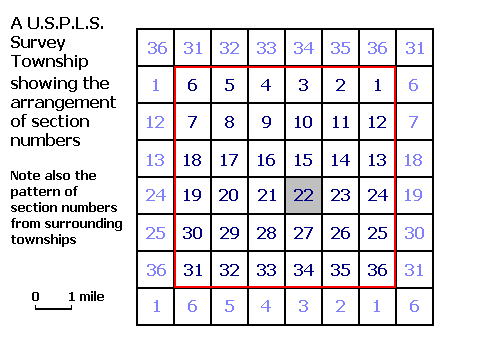
When you see the sections shown on topographic maps, look for that pattern. It will help to guide you to the survey township boundaries and, consequently, to the identities of the survey township.
PLSS Quarter Sections
Finally, the sections are also usually subdivided. Consider that an entire section, one square mile in size, is equal to 640 acres. In earlier times that would have been much more than a family could manage as a farm. As ranching became more common, and today with corporations owning large amounts of land, larger portions of sections, or even entire sections might be owned by one property owner.
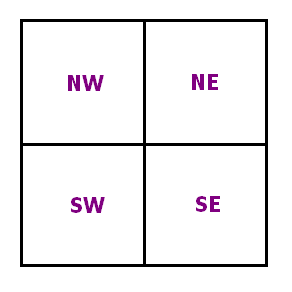
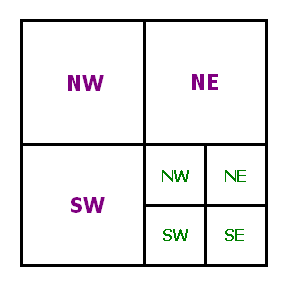
The most common way to subdivide a section is into quarter sections (see the diagram of the PLSS Quarter Sections, below). Each quarter section is a half-mile by half-mile square, enclosing 160 acres. The quarter sections are identified by their location within the Section: northeast (NE), northwest (NW), southeast (SE) or southwest (SW). Occasionally, the subdivided piece will be half of a Section, either the north, east, south or west half (320 acres in size).
PLSS Quarter Quarter Sections
The quarter sections are also often subdivided. Each quarter of a quarter section (see the diagram of the PLSS Quarter Quarter Sections, below) is a quarter-mile by quarter-mile square, enclosing 40 acres. Once again these divisions were usually either quarters or halves, identified the same way as above.
Putting it All Together
If you are fortunate enough to own 40 acres or more of land in the parts of the country surveyed under the PLSS, your property's deed description can be very brief. Here are the four levels of increasing detail for a 40-acre farm property, first in maps and then in text(Note: the order of the text is very important, so pay attention to the example):
The property depicted in the maps above is: the Northwest (NW) Quarter of the Southeast (SE) Quarter of Section 22, in survey township T3N R2E.
How precise is that description? Given the structure of the system, a quarter of a quarter section gets you within a quarter mile square. If it were used as a system to describe the location of an object, the PLSS still requires you to search in an area 1320 feet by 1320 feet (40 acres) in area. How does that compare to Metes and Bounds?
Deviations from the PLSS
The US government agency responsible for maintaining information about the PLSS is the Bureau of Land Management, within the US Department of Interior. The lands were originally the property of the US government following the Revolutionary War and treaties made by the young US government with England and France and, later, Spain and Mexico. Some areas acquired then still are owned by the federal government. It was the federal government that laid out the original PLSS boundary lines.
As you look at various USGS quadrangles, which mark PLSS boundaries clearly, you will see some localized exceptions. One example is areas that were previously owned by French and Spanish settlers, who used a very different survey systems. Other exceptions occur in small areas preserved by the federal government.
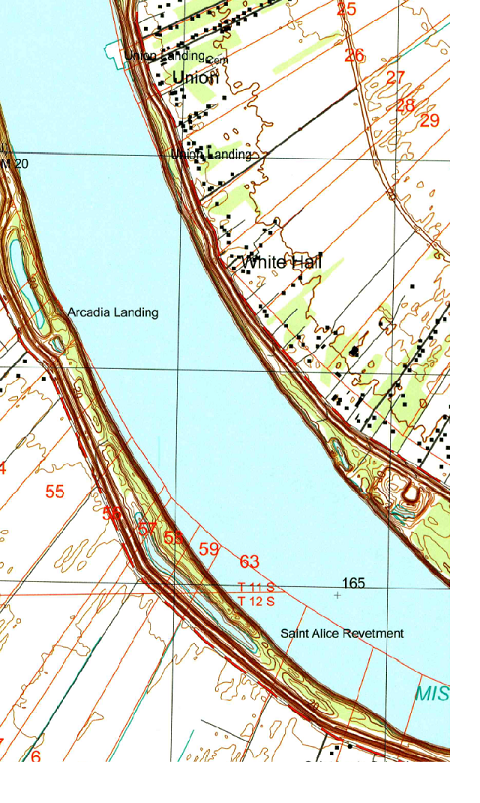
French Long-Lot Survey System: Areas that were previously owned by French settlers used a very different "long lots" survey system. In French tradition, different as it is from the English tradition, land was more likely to be surveyed in long narrow lots leading off of a river, a main road, or even radiating out from a village or town. The longer sides of these lots are usually straight lines. Like the one square mile PLSS sections, these were assigned numbers within their PLSS survey townships for mapping and record-keeping purposes. The map excerpt below from the 2005 Donaldsonville, Louisiana USGS quadrangle shows the outlining and numbering of the French long lots. It is generally found in parts of North America that included land owned by French colonists before the territories were turned over to the United States, such as in parts of Canada and northern New England states, and also in Louisiana.
Spanish Land Grants: Parts of the south and southwest had Spanish or Mexican settlements before the territories were turned over to the US government. The property ownership was largely recognized by the US and excluded from the PLSS.
Federal Government Lands: The US government was unable or unwilling to sell many acres of land within the western territories. In fact, even in survey townships where they did sell most of the land, they often retained a survey section for federal use. Many uses are for government needs such as military bases, while others, such as national parks and forests, have become sources of income for the federal government and/or means of preserving exceptional sites. When there is no prospect of private land ownership, the PLSS boundaries are not drawn.
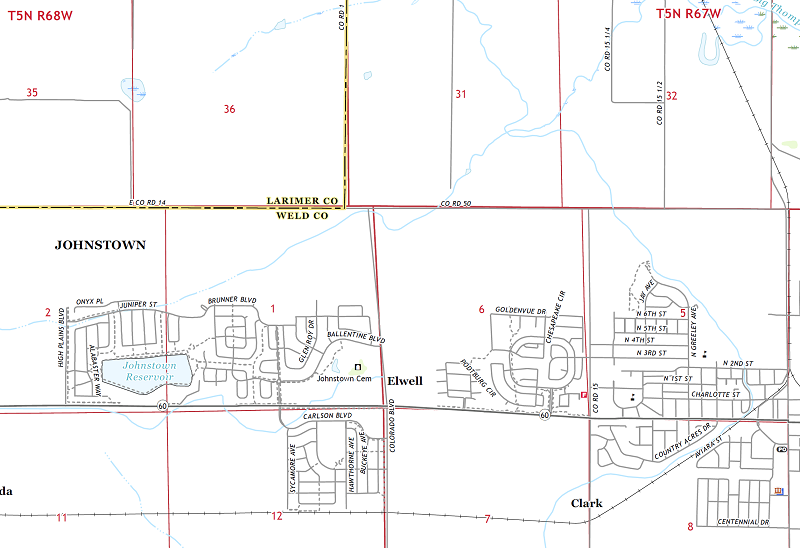
Periodic Adjustments to PLSS Boundaries: When a rectangular grid is superimposed on the round Earth, like the PLSS was, the curvature of the Earth will cause problems. Consider that the principle meridian of each PLSS territory is a true north meridian and the first township's eastern boundary is a line that should be parallel to it and six miles east of it. That means that the first township's eastern edge is not a true north line. Add multiple ranges of townships in addition to that first one, and the distortion accumulates. To some extent, the deviations were absorbed into some of the survey sections, and therefore their respective quarter sections and so on. Those changes are not readily apparent on the USGS quadrangles. Occasionally, though, more significant adjustments were made to the boundaries of the survey townships; those adjustments are more readily apparent, as shown below on the Johnstown, Colorado quadrangle (the contours layer has been turned off).
The US National Grid
Military Grid Reference System
Of the location and survey systems shown so far, each one has its advantages and disadvantages. None is perfect for all users, although the one that identifies point locations most efficiently and precisely is the latitude-longitude system. The US government is still concerned that it does not have an easy and efficient system that works in every part of the country. They consider the latitude-longitude graticule to be difficult to understand because of the need to use degrees, minutes and seconds and because it is based in non-Euclidean geometry instead of plane geometry. Of course, we now know that the use of decimal degrees instead of degrees, minutes and seconds can alleviate one of those problems. Nevertheless, they decided to work to try to come up with a solution. Their offering is called the US National Grid.
First, we need to understand the origins of the US National Grid. It emerged from the military's need for plane geometry-based coordinates to enable faster analysis for distance and location measurements. We have seen two systems based in plane geometry, the UTM coordinate system and the State Plane Coordinate System. The SPCS was eliminated from consideration because there are too many origins and map projections to worry about. The UTM system by comparison is a global system, which appealed to the military. Almost all the sources on the subject omit that it still requires the integration of 60 separate zones in the northern hemisphere, 60 more in the southern hemisphere and two more for each of the polar regions of the world.
The Military Grid Reference System (MGRS) is based on the UTM coordinate system.
Other countries, most of which are smaller than the US, have established national coordinate systems that use a single grid system to represent locations anywhere in the country and that avoid the challenges of the latitude-longitude system. The size of the US makes such a task inherently more challenging. The US military created a solution, the Military Grid Reference System (MGRS), that is derived from the UTM coordinate system.
The MGRS is a land partitioning system designed primarily for location purposes. The two purposes are somewhat at odds: "land partitioning" refers to areas while "location" refers to points. The concept developed in the MGRS is that any point location will always have a certain degree of uncertainty. That uncertainty can be envisioned as defining the location of a larger area instead of just a point. This approach especially makes sense if the objective itself is larger, such as a larger building or an area such as a town.
A second fundamental, underlying concept developed in the MGRS is the need to communicate the degree of uncertainty in the location specifications. This has parallels to the US Public Land Survey System's use of townships, sections, quarter sections and quarter-quarter sections. If the area's location is described using fewer terms, it describes a larger area. By extending the description of the area to include more terms, we can reduce it to a smaller area of the Earth.
The third fundamental principle embedded in the MGRS is the expectation that the US will one day adopt the metric system for distance measurements. Like the UTM grid, the MGRS is inherently metric, to the point where conveying distances in feet or miles could be disruptive.
MGRS Locations
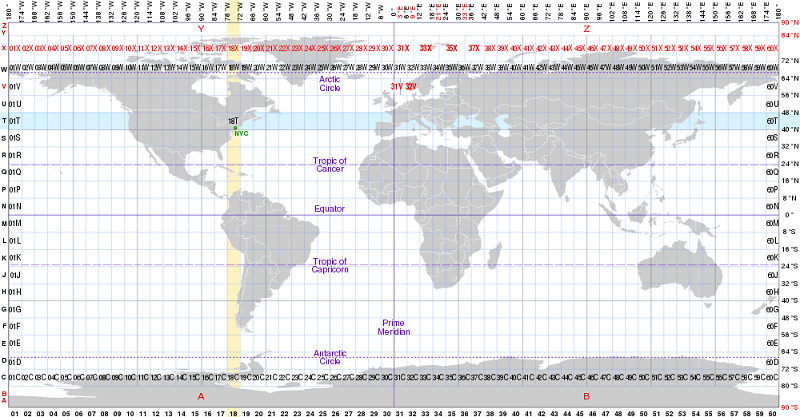
When we last saw the UTM system, we pointed out the 6°-wide zones mapped as Mercator projections positioned vertically (transversely) on the Earth. The zones are numbered from 1 to 60 starting at the 180° W meridian (to differentiate it from the International Date Line) and continuing every 6 degrees eastward. Those numbers are the starting point for the MGRS. Zones 10 through 19 cover the 48 contiguous US states, Alaska spans zones 1 through 7, and Hawaii is in zones 4 and 5.
Rather than identifying the point locations using the number of meters east (the "eastings") and then north (the "northings") for their respective UTM zone, the military decide to break those 6° wide zones into a non-square grid with rows of areas at intervals of eight degrees of latitude north from the equator (the last row has to cover 12 degrees of latitude) to 84° N. These areas are called Grid Zones. The horizontal rows of these areas are given capital letter identities which, together with their zone number, are used as Grid Zone Designations (GZDs). The system is set up with equivalent rows of areas in the southern hemisphere, and the consecutive letters (skipping I and O because they can easily be confused with numbers) start with C at 80° S, reach N at the equator, and finish with X at 76 degrees N. The letters A and B are used for the east and west hemisphere areas of the south pole zone, and the letters Y and Z are used for the east and west hemisphere areas of the north pole zone. Millersville is in GZD 18S and 18T. The latitude that separates those two areas is 40° N, which runs right through the university campus. UTM zone 18 includes the area between 78° and 72° West longitude, GZD S includes the area between 32° and 40° North latitude and GZD T includes the area between 40° and 48° North latitude.
Grid Coordinates
Obviously, a 6° by 8° area covers a large portion of the Earth, and is not very precise for location purposes, so the system continues by subdividing it. Also, remember that a 6° by 8° area covers a larger area near the equator than it does farther north or south. The next level of subdivision standardizes smaller areas that are oriented to the UTM grid and that are 100,000 meters (100 kilometers, or about 60 miles) in length in both the east-west and north-south directions. These are called "100,000-meter Squares." This is the scariest part of the "system" because they are identified using pairs of capital letters (again, skipping I and O). The first letters of these pairs progress through the alphabet from west to east until they reach Z and then start over. The second letters of these pairs progress through the alphabet from south to north, and again start over when needed. That does mean that some two-letter names will repeat, but not within an area as large as a US state. These are called 100,000-meter Square Identifiers. When we saw the UTM labels on the USGS quadrangle, it was printed with one or two smaller digits, two larger digits; in both the southeast and northwest corners of the quadrangle that was followed by "000m" in small characters again, and then by a large capital N. An example showing the McComsey Hall area of the Millersville campus is shown below. These 100,000-meter Square Identifiers effectively replace the two small digits at the beginning of those labels, since those digits would only change every 100 km. Millersville is in the "UK" 100,000-meter Square. Put the first two elements together and you have: 18S UK.
It was mentioned above that, like other partitioning systems, the MGRS creates a hierarchy of nested rectangles. This next stage is where that nesting builds to its maximum precision. A 100,000 meters x 100,000 meters square will have coordinates that can go from 0 meters to 99,999 meters in both directions (it does not need to go all the way to 100,000 because that would be the 0 for the next square). With such a measurement you are within one meter of any object that is smaller than that. Within the 100,000 meters x 100,000 meters square, there are 10,000,000,000 individual one-meter squares, each of which has a unique location specified. Any measurement from 0 meters to 99,999 meters, then, can be stated as a 5-digit number. The coordinates for any point in that area would require two 5-digit numbers, for example: 84,664 meters East and 28,416 meters North.
However, that is not how the MGRS location is reported. No commas are used, and the two 5-digit numbers are just run together into one long 10-digit number: 8466428416. If either of the 5-digit values is less than a 5-digit number, leading zeroes are added; for example: 0045600023. The system relies on the fact that using square areas makes both the eastings and northings numbers the same number of digits; that in itself lets you know that the first half of the long line of numbers is the easting and the second half is the northing. These are known as the Grid Coordinates part of the location. Put all these elements together and the full location of the desk in Dr. Geiger's office is 18S UK 8466428416 (relative to NAD 83).
We have not encountered any "nesting" with that location. It really gives the maximum precision with the largest number of units for the smallest-sized feature. However, if we are specifying the location of an object that is 10 meters by 10 meters (or 100 square meters) in size, it does not make sense to give such a precise location description. In such a case the MGRS allows for a less precise location by requiring fewer digits. Instead of 10,000,000,000 one-meter squares, we are trying to identify one of 100,000,000 hundred-square-meter squares. One hundred square meters is more like two McComsey Hall offices. To illustrate the point, that location would just require four-digit eastings and northings. The MGRS location of the group of offices should look like: 18S UK 84662841 (NAD 83). Notice that the separate five-digit numbers were not changed to four-digit number by simple rounding, but by rounding down. This guarantees that the smaller one-square meter area is within the larger 100-square meter area.
We can do the same process to specify a landscape element that is 100 meters by 100 meters in size, like the entire Geography Department (roughly). There are only 1,000,000 such possible locations within the 100,000-meter Square, and it will only require a three-digit easting and three-digit northing. Again, round down to specify the larger area enclosing the previous smaller area; that is what makes this a nested system. The location of the Millersville University Geography Department in Pennsylvania is 18S UK 846284 (NAD 83).
Finally, a square kilometer area (1,000 meters by 1,000 meters) can be located with Grid Coordinates that use two digits for eastings and two for northings. Ten thousand square kilometers fit within our 100,000 square meter area. The area surrounding our department, larger than McComsey Hall, could be identified using: 18S UK 8428 (NAD 83). If you look again at the map just above, those Grid Coordinates are the same as the larger numbers of the UTM coordinates above.
From the MGRS to the USNG
A coalition of US government agencies seeking to establish a national grid for the US agreed to adopt the MGRS as "The US National Grid." The decision was made more than a dozen years ago, with the intention of making it a requirement for all military and emergency response operations. Of course, getting it into civilian emergency response agencies that report to state and federal emergency response agencies would require a massive public education effort. The big question is whether it will be accepted into common use by the civilian and local government agencies, as well as the public.
Below is a link to a federal government website (FGDC) in which they describe how they derived the US National Grid location of the Washington Monument in downtown Washington, DC as 18S UJ 23480647. The precision of that location is a 10 meter by 10 meter area.

It has been in existence for more than a dozen years and is seen very infrequently. You should be aware of its existence, however, in case it does come into wider use. If the federal agencies involved do make a greater effort to infuse this grid into use in all levels of government and into the public education system, there will have to be a great deal of public and professional education, so you will have the opportunity to learn more about it then.
The biggest issues with trying to make this a commonly used system might not even be the challenge of learning all the numbers and letters to determine something's location. Its biggest advantage is that, as a square grid, distance calculations could be relatively easy. That would make it usable for most locations within the US. Here are two issues that would have to be considered:
- Only along the western edge of the 6-degree wide UTM zones would Grid North align with True North. That may not be an issue with most applications but could raise questions. The map below shows parts of UTM zones 17 and 18 (in central Pennsylvania) aligned with the meridian for the west edge of zone 18.
- Areas at the intersections of UTM zones and 100,000-meter Squares, as shown below, will have to deal with transitions of the grid coordinates. What does that do to the ease of making area and distance measurements, which were so simple in other areas of these zones and squares?
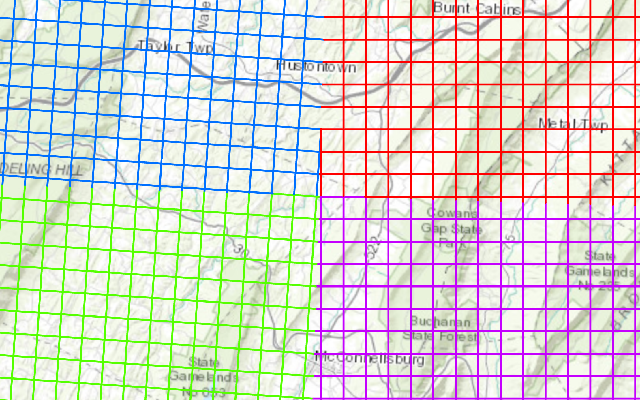
Interestingly, and potentially another issue, if you type US National Grid into an online search engine, most of the sources are not talking about the national grid as a mapping system, but as the network of interconnected electrical systems across the US. This other US National Grid is also receiving a lot of attention because of issues maintaining sufficient electrical production and distribution.
You will not be expected to learn all the details about the (mapping-based) US National Grid because it is so complicated. However, it is worth being acquainted with it and understanding its general components and issues. Who knows, you may be forced to make the transition to it one day.
Survey Systems in Adobe Reader and ArcGIS
Survey Systems on USGS Quadrangles
Metes and Bounds and the USGS
USGS Quadrangles do not display the Metes and Bounds Survey System at all. It would be an interesting discussion with a historian to decide whether colonial road placement in America determined the oddly shaped properties early settlers often ended up with, or whether oddly shaped properties determined the paths of those early roads (or, of course, some combination of the two). It is safe to say, though, that we see little "pattern" to either in the eastern states of the US.
Property boundaries are mostly invisible in the eastern states also, to the naked eye and in aerial photographs. Some landowners will fence their properties, but not many. The closest we come is the gridded streets of the towns and cities, which will be a significant topic later in this course. Probably for those and other reasons, the USGS never attempted to add property boundaries to their quadrangles in the eastern US. Of course, roads are always present as a layer, so that will have to serve as our clue to the local survey system there.
The PLSS and the USGS
The US Public Land Survey System, as presented above, can only be found on maps of areas in the Great Lakes states west of Pennsylvania, the Gulf of Mexico states other than Texas, and all other states west of the Mississippi River except Hawaii.
The USGS does include the US Public Land Survey boundaries on quadrangles in areas of the US where that system is in effect. Because that system was laid out before most land was privately owned by European Americans, the property ownership system did heavily influence the road system.
To view the PLSS on digital USGS quadrangles (once ensuring that the quadrangle is in the PLSS area), open the quadrangle's PDF file in Adobe Reader and expand the Layers list and then the Map Frame layer. Near the top of the Map Frame list is a layer called Projections and Grids that is turned on by default. Because it consists of other sets of grid lines, it generally confuses attempts to view the PLSS, so turn it off.
The Public Land Survey System layer is further down the list, identified as "PLSS," and turned off by default. Obviously, we need this layer turned on. The most prominent component of the PLSS is the square Sections, shown by their red boundary lines and their red section identifiers. Remember the numbering pattern of the Section numbers (shown above) and look for a group of contiguous Sections that belong to the same survey Township. Given the scale and extent of USGS 7.5-minute quadrangles, there are more likely to be partial survey Townships than complete ones (with all 36 Sections). Near the middle of each group of Sections from the same Township will be the identity of that Township, labeled in red text.
The USNG and the USGS
We have already experienced the list of Layers visible on the newer digital USGS quadrangles. One of the top layers within the Map Frame layer in that list is the Projections and Grids layer. Turn it off and back on, and notice that it is displayed in a dark yellow color, with black lines edging the map and black labels around the edge. These make up the grid of 1,000-meter scale of the UTM coordinate system, and also the 1,000-meter squares of the MGRS and USNG location systems.
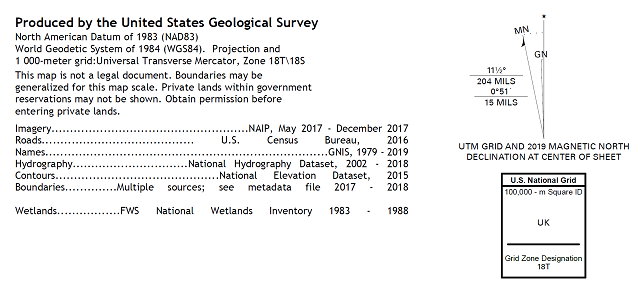
The US National Grid has made headway in reaching wider public dissemination in at least one more way. It is now named on every digital USGS quadrangle. The image below shows reference information provided in the lower-left corner of the Lancaster, PA quadrangle. In the left-hand block of text it identifies that the quadrangle is associated with UTM zones "18T/18S." Zone 18S does not actually appear on this quadrangle, but is no doubt listed because the latitude of the southern edge of this quadrangle is 40°N, which is also the edge between Grid Zones 18T and 18S. To the right of that block of text, just below the declination diagram, is a specific reference to the US National Grid. It identifies both the Grid Zone Designation and the 100,000-meter Square that cover this quadrangle.
GIS Layers for Survey Systems
The descriptions here will be of the PLSS and the USNG, since they are widely applied and federally supervised survey systems. Public versions of layers containing metes and bounds surveys and those in other survey systems may be avaiable from stzte or local government sources. It is not likely that their availability is universal yet, and they may not be available for free download. Since government uses will include information about the property owners, it is likely that such information will be redacted in publicly released versions.
The PLSS in ArcGIS
The Bureau of Land Management maintains the PLSS data layer and makes it available, consistent with federal GIS practices, for download and use in GIS software. Keep in mind, as described above, that the layer is not continuous over the entire US. There are areas of the country in which alternate “survey systems” were in effect before the PLSS was established, including the first 15 or so states that used the British “metes and bounds” survey system, areas along the Mississippi River settled by the French using their “long lots” system and the entire state of Texas. Those areas are left blank in the PLSS data files. Beyond that general description, there are parts of the PLSS areas of the country where PLSS survey townships have been eliminated; those are areas where the land is still in the hands of the federal government and the government plans to retain ownership indefinitely. The same thing goes for the smaller areas within those survey townships.
The layer can be downloaded from the 'catalog.data.gov" website. Note that it is a nearly 7 Gb (gigabytes) file, which is an enormous file. It arrives as a ZIP file, but when unzipped the result is folder named "BLM_National_PLSS.gdb". This is a different type of ArcGIS data file, known as a "geodatabase" file. Typically, folder names do not have the period (or "dot") character as part of their names, though Windows does allow it. In this case it serves as a signal to the GIS software that this file format is different from the shapefile format. The geodatabase folder contains over 40 smaller files (similar to the way the shapefile format includes multiple smaller files, but in a rather more structured system of file names.) The geodatabase is the recommended format for professional GIS use, especially where large amounts of data are needed. You will use it much more in the next GIS course you take.
Since the PLSS is a multi-level system, it will not arrive as a single layer. The survey townships are one layer, named "PLSSTownship." The survey sections are a second layer, named "PLSSFirstDivision." The survey quarter sections and quarter quarter sections are combined in a third layer, named "PLSSSecondDivision." Each of those layers includes attribute data specific to its level of the PLSS hierarchy. A fourth layer, named "PLSSIntersected," shows the quarter quarter section area features, and includes in its attribute table their specific identifiers and all of the identities of the higher-level areas they are part of.
Using the PLSS Layers: Given the sizes of these survey townships, sections and fractions of sections, they really will not be useful for smaller-scale maps. Map scale and extent should also be taken into consideration when deciding the level(s) of the PLSS to included in a map. At smaller scales, the collection of quarter section lines makes the map look like one solid color. Zoom in to county-sized areas or smaller to begin to see the layers in a practical way.
Because of the enormous size of the file, the layers in the PLSS layers, especially the more detailed layers, are rather slow to draw on your computer. There are ways (beyond the scope of this course) to isolate smaller areas of the file and save them separately, which speeds up the drawing time considerably.
The final consideration is what these layers will contribute to a map. While it is true that the PLSS certainly defined the placements of roads and other landscape elements, they should be central to the maps purpose if they are to be included. Keep in mind that, because they are added to the map in separate layers, searching for a particular property using its PLSS description (see the procedure above), unlike the USGS/Adobe procedure, will have you jumping between layers. Only the "PLSSIntersected" layer depicting the quarter quarter sections will have complete township, section, quarter section and quarter quarter section subdivisions labeled, but it is not listed in a single attribute table field that is easy to read.
The USNG in ArcGIS
It gets a little tricky locating GIS layers to represent the US National Grid. Like the PLSS layers described above, the USNG cannot be contained in a single shapefile. It is technically possible for the shapefile to contain the 1-meter Grid, and then to include in the layer's attribute table which lines are part of the 1-meter grid only, part of the 1-meter and 10-meter grid only, part of the 1-meter, 10-meter and 100-meter grides only, etc. It would then require adding that layer multiple times and then symbolizing just the one set of lines in each version of the layer. That becomes complicated as well as prone to error.
There are online sources of USNG shapefiles but most are allowing us to download the layers for just one area of the US. The bottom line is that you have to do your research, know which level of detail you need for your USNG layer(s), find a reputable (probably governmental) source and then investigate what attribute table columns are present. The fact that the USNG is based on both the UTM coordinate system and the MGRS means that you will also encounter comparable layers intended for those systems. Some may come with better documentation or better examples.
There are other ways to add the National Grid to your ArcGIS Pro map. Both of the ones to describe now are beyond the scope of this course, but will no doubt be included in the higher-level GIS courses here at Millersville University. The descriptions here will give you a sense of the capabilities of ArcGIS beyond the introductory level being taught here.
One way is to add the USNG as an online layer. We are only learning to use the shapefile data format for spatial data in this textbook, but there are other data formats in use. One of the online sources is Esri's website known as "ArcGIS.com." It holds spatial data from many sources, including governments, Esri itself, and many user-supplied data layers.
Another option is adding the grid as an overlay separate from the list of layers shown in the Contents list. ArcGIS Pro can show a selection of different "grids" in this way, including different levels of detail for the latitude-longitude graticule. There are some ways to customize these grids, too, but this becomes very complex very quickly. This capability is part of the Layout View of your map, which you will learn in a future unit as a way to add titles, legend, map scale and other elements to your map.