Grid Properties of Earth and Globe
The Properties
The Earth's latitude-longitude graticule has all these characteristics.
You have to think of straight lines, right angles and measurements such as distance and area a little differently on the sphere than you do on a flat plane. Since these are true of our (nearly) spherical Earth, they are also true of globes. A Globe is the only true scale model of the Earth.
- Parallels are drawn as straight lines, parallel to each other.
- Parallels are equally spaced on all meridians.
- Meridians, the equator and other great circles are drawn as straight lines.
- Meridians converge at the poles.
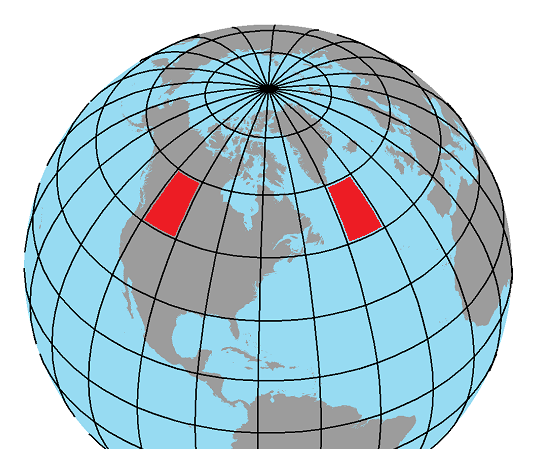
- Meridians are equally spaced on each parallel, but the distances between meridians decreases from the equator to the poles.
- Parallels at 60° latitude are half the length of the equator, and the distance between two meridians at 60° latitude is half the distance between the same two meridians at the equator.
- Parallels and meridians cross each other at right angles.
- The area of the surface between any two parallels and any two meridians is the same anywhere between the same two parallels and between two other meridians spaced the same as the first two. This statement also holds true for the shape of that surface area.
- The scale of a globe is true in any direction and in any location.
Analyzing the Properties
In all map projections, at least one of the properties listed above is violated.
Repeat: Map Projections always distort one or more of these properties of the spherical Earth and the non-Euclidean graticule. Before we can understand Map Projections we must understand what is being projected. It is the Earth (as a sphere) that is being projected onto a flat surface. It is often easier to think of the globe as the sphere being projected than the Earth, since the resulting map is also at a reduced scale.
First, notice that several properties describe very obvious characteristics of the Earth's latitude-longitude grid:
- Parallels are drawn as straight lines, parallel to each other.
- Parallels are equally spaced on all meridians.
- Meridians converge at the poles.
- Meridians are equally spaced on each parallel, but the distances between meridians decreases from the equator to the poles.
- Parallels and meridians cross each other at right angles.
The two properties that describe equal spacing refer to the fact that both latitude and longitude are essentially angle measurements, so that any value (from 0° to 90° for latitude and 0° to 180° for longitude) is actually possible. In reality, though, most maps will show parallels and meridians at a set interval such as every 10° or every 15°. The term "spacing" refers to that interval, measured in degrees.
Next, focus on the following property describing the Earth's latitude-longitude grid:
- Meridians, the equator and other great circles are drawn as straight lines.
It is much like the property stating that parallels are straight lines, except that it mentions "great circles." First of all, realize that any two points on a globe (unlike any two points on a plane) can define a number of different straight lines. To demonstrate this, hold a globe or any ball and mark two points, A and B. Starting at point A, head toward point B in a straight line that wraps over the top of the surface of the sphere; continue that path until you come back to point A. You can also "tilt" your sphere while creating another straight line that does the same thing. Now imagine cutting the sphere in two parts along the line you have circumscribed.
Great Circles:
A great circle is any straight line around the earth (or globe) that could be used to "cut" the sphere into two equal halves. There is only one line between points A and B that will generate that result. What's more, the great circle route between two places is the shortest distance between those two points. That is the path that an airplane would prefer to travel to get from place A to place B. The video clip below demonstrates the concept.
This is why great circles are a special consideration in talking about the latitude-longitude grid on the Earth. Again, we will pay attention to how this property is "violated" in particular map projections.
Finally, focus on the following property, known as the "equal area" property, describing the Earth's latitude-longitude grid:
- The area of the surface between any two parallels and any two meridians is the same anywhere between the same two parallels and between two other meridians spaced the same as the first two. This statement also holds true for the shape of that surface area.
The complicated wording describes a fairly easy concept. For an example, let's say we have a globe with parallels and meridians spaced every 15°. Choose the parallel labeled 45° North latitude and 60° North latitude. Then find the two meridians labeled 75° West longitude and 90° West longitude. The area enclosed by those lines is not a rectangle in the traditional sense, which is to say the Plane Geometry sense, but it is actually a rectangle because all four of its corners are right angles. If that area is traced onto a piece of paper and that piece of paper is shifted to the east or west between the same two parallels, so that its eastern and western edges line up with another pair of meridians, then those new meridians will also be spaced 15° apart (east to west). This implies that the area enclosed by that rectangle is always the same, as long as we follow those rules.
Again, what this will mean, when we begin looking specific examples of different map projections, is that on some maps the same property will be maintained, but on other maps some of these areas representing a span of 15° of latitude (always sticking to the same two parallels) and 15° of longitude will vary in the size of the area of paper they occupy.
The "Projection" Concept and Reality
The "Projection" Concept
The "projection" concept can be likened to using a semi-transparent globe for the source of our map's content, installing a light in the center of the globe, wrapping a sheet of paper around the globe, and tracing the "projected" lines onto the sheet of paper, which can then be unwrapped from the globe and used as our map.
Trying to apply this concept develops complications very quickly because it is difficult finding transparent globes, because the light source would have to be infinitely small or movable to make the geometry of the projection effective, and because the paper and one's ability to draw on it are unlikely to prove satisfactory.
On the other hand, this visualization enables cartographers to illustrate several projection concepts. The three potential paper surfaces will be illustrated in the next page. It is possible to illustrate the projection concept as straight lines representing rays of light from the light source, through the points on the globe and ending at the corresponding points on the paper. And, it turns out that the position of the fictitious light source can be varied to great effect.
The "Projection" Reality
In point of fact, map projections are never constructed using transparent globes. The true nature of map projections is based in the fact that the globe locations are a matter of non-Euclidean geometry, the corresponding map locations are a matter of plane geometry, and the process is accomplished using mathematical formulas to convert the former into the latter that are frequently complex. In this course that is all we need to know about the process. Further coursework would be required to learn the mathematics of map projections.
Recognize, though, that each different projection/formula results in a different arrangement of the lines representing the parallels and meridians on the flat projected map. With each projection some of those original nine (9) properties are preserved and some are altered. The results in each case serve a different purpose for the author of that projection, and are best suited to a particular map application. The cartographers who develop these projections give them formal names, many named after the cartographer himself, and there are many hundreds altogether.
Of course, it is very easy for computers to perform the calculations required. If the map projection component of the map making software receives the coordinates of points, lines and areas on the map in their true latitude-longitude location, it can then calculate the corresponding position of that point on the flat computer screen, and on the printer paper.
Categories of Projections
The Map Surface
The flat surface on which the map is drawn starts as a grid of parallels and meridians. Sometimes that grid looks like a typical grid of right-angled straight lines. More often, those lines are distorted in some way.
There are three broad ways in which the spherical grid converted to the flat map grid. These three ways are categorized as three ways to handle a flat sheet of paper in three dimensions. These are referred to as "developable surfaces." The three developable surfaces are the cylinder, the cone and the flat plane.
Again, no one actually projects the image with light, and then traces the image and unwraps the developable surface, but it does serve well as a visual representation of the mathematical conversion process. Notice that the cylinder touches (we will say: "is tangent to") the globe along the equator, the cone is tangent to the globe along a parallel in the northern latitudes, and that the plane is tangent to the globe at a point. These represent another key concept in understanding the benefits of, and differences between, different map projections.
The three categories of map projections based on these developable surfaces are:
- Cylindrical
- Conic
- Planar (also referred to as Azimuthal)
Learning Goal:
By the time you finish this topic you should be able to look at any map showing an entire country or larger area and make a logical decision about which map projection category that map fits.
When it comes to smaller areas, that assessment is much more difficult. Many maps of counties, cities and other small areas are simply one piece cut out of a larger projected map and there are not enough visual clues to tell the difference. An excellent example of this is the USGS topographic quadrangles we will be working with. Where it might be important to know how a map was created, information about the map projection will often be printed somewhere on the map.
Cylindrical Projections
General Characteristics
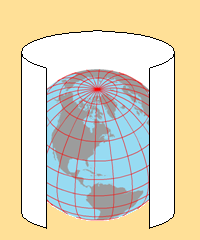
The first category of map projections consists of the cylindrical projections. Virtually all world maps fall into this category. The concept behind the cylindrical projection is that a cylinder of paper has been wrapped around the globe so that surface features can be "projected" onto the paper and traced there (see diagram below). Remember, it doesn't really happen that way; it's really done with complex mathematical equations. This visual representation allows you to see that the entire Earth can be represented on one map this way.
One key map projection concept that can be seen with the diagram above is that the cylinder "touches" the Earth only along one line: the equator. This "line of tangency" represents the basis for measuring the scale of the projected map. In fact the stated scale for most cylindrical map projections is accurate only at the equator.
Further into this discussion of cylindrical projections you will be shown three sub-categories of cylindrical projections: rectangular cylindrical projections, non-rectangular cylindrical projections and interrupted cylindrical projections. For this course, you goal is to be able to identify which of those three sub-categories any world map you are shown is in. In order to determine which projection category and sub-category a particular map is in, you will always need to focus on its graticule of parallels and meridians, often aided by recognizing the shapes of commonly viewed continents and countries.
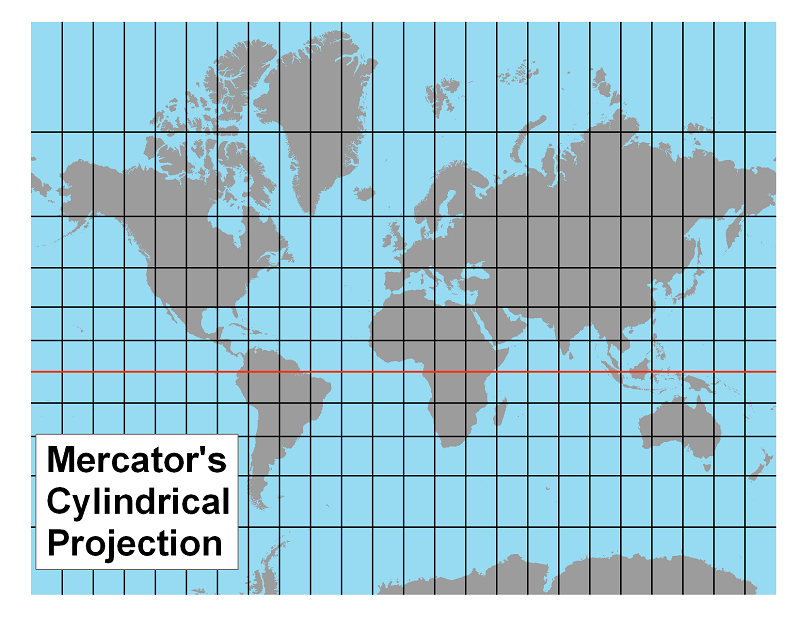
Mercator's Cylindrical Projection
Let's follow one example through this introduction to cylindrical projections. It is one you may have heard of elsewhere because it was the first map projection (created in the 1560s) and played a significant role in the historical Age of Discovery. Mercator's Projection is shown in greater detail if you click on the link below.
In the previous discussion it was stated that all projected maps violate at least one of the properties listed below. In the right-hand column is an indication of whether each property is maintained or not on Mercator's projection. Remember, the properties of the globe must be examined in the context of Non-Euclidean Geometry, while those on the right are re-examined in the context of Plane Geometry.
| 1. Parallels are drawn as straight lines, parallel to each other. | still valid |
| 2. Parallels are equally spaced on all meridians. | not valid |
| 3. Meridians, the equator and other great circles are drawn as straight lines. | only valid for meridians and the equator |
| 4. Meridians converge at the poles. | not valid |
| 5. Meridians are equally spaced on each parallel, but the distances between meridians decreases from the equator to the poles. | meridians are equally spaced but distances do not decrease |
| 6. Parallels at 60° latitude are half the length of the equator, and the distance between two meridians at 60° latitude is half the distance between the same two meridians at the equator. | not valid |
| 7. Parallels and meridians cross each other at right angles. | still valid |
| 8. The area of the surface between any two parallels and any two meridians is the same anywhere between the same two parallels and between two other meridians spaced the same as the first two. This statement also holds true for the shape of that surface area. | still valid |
| 9. The scale of a globe is true in any direction and in any location. | not a globe |
Rectangular Cylindrical Projections
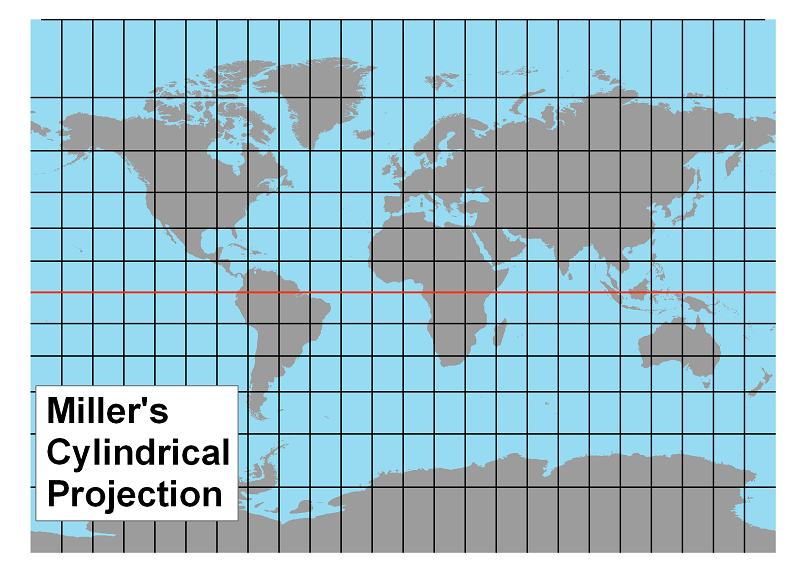
The Mercator Projection was one example of a Rectangular Cylindrical Projection. The defining characteristic of rectangular projections is simply the overall shape of the world map. The main reason for that is that both the parallels and meridians are drawn as straight lines.
The main variation among the different specific rectangular map projections is the arrangement of the parallels. Some, like Mercator's, increase the length of a degree of latitude as the latitude increases; those near the equator are shorter than those near the North or South Pole. Others have followed the same concept but increased that length of a degree at different rates. Still others keep that length constant or decrease it a different rates.
The Mercator Projection (see map above): Mercator's map exhibits many flaws when used as a general world map, for non-navigational purposes. One of the most obvious is the size distortion of continents and islands near the north and south poles compared to those in the "mid-latitudes" (30° to 60° north or south). To see it best, compare the sizes of Greenland (an island) and South America (a continent) on a globe, and then do the same on a Mercator projection such as the one above.
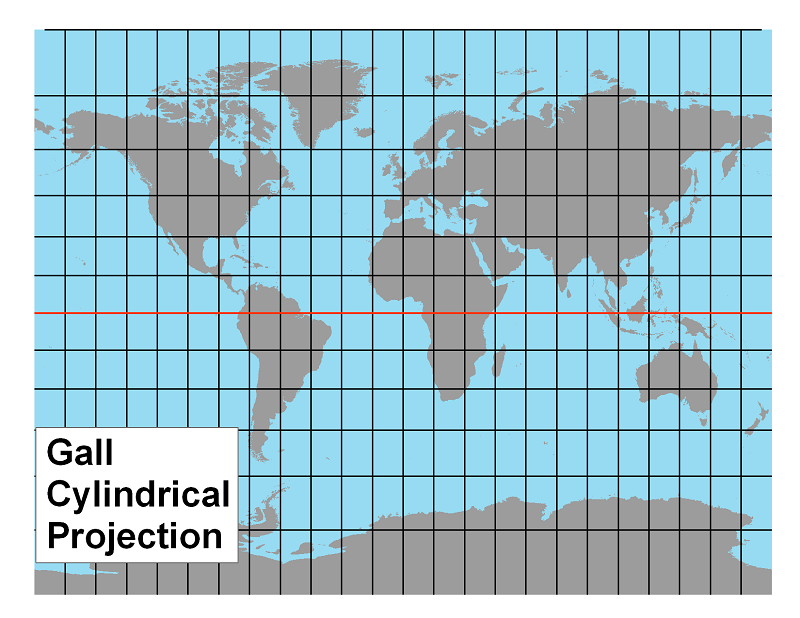
The Gall Projection: This projection is termed a compromise projection because it is neither equal area, conformal, equidistant nor azimuthal. The compromise, though, brings the areas in the polar regions significantly closer to their true size by reducing the length of a degree of latitude in those polar regions. Compared to Mercator's projection, though, a degree of latitude near the equator is a little longer in Gall's projection.
The Miller Projection: This projection is also a compromise projection. Miller appears to have preserved some properties of both the Mercator and Gall projections. The polar areas are very similar in latitudinal length to Gall's, while the latitudes near the equator are more like Mercator's.
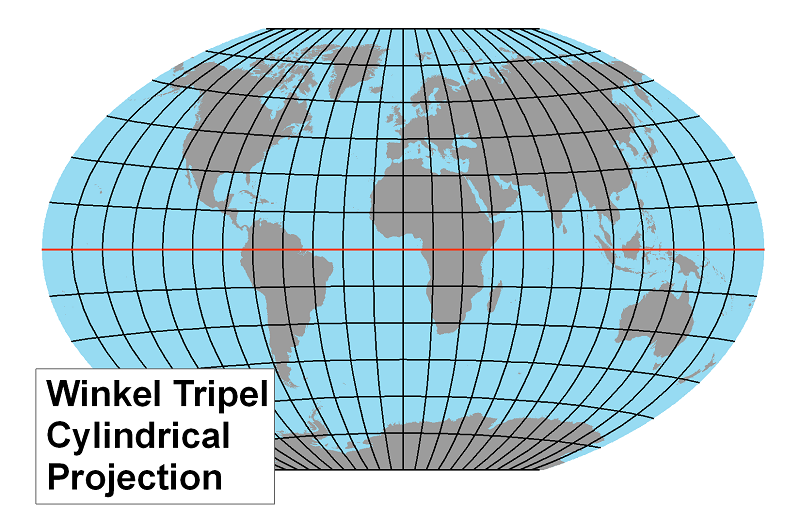
Non-Rectangular Cylindrical Projections
The biggest problem with the Rectangular Cylindrical Projections is the excessive sizes of areas in polar regions. Non-rectangular projections are designed to avoid that distortion.
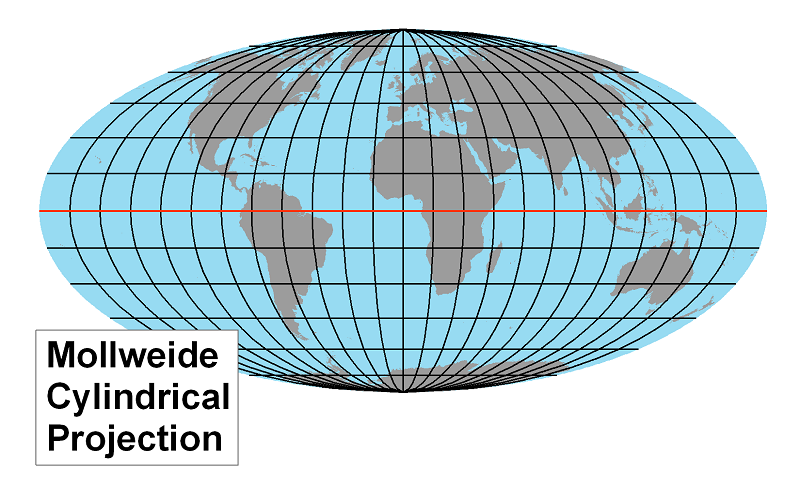
As with rectangular projections, the defining characteristic of non-rectangular projections is simply the overall shape of the world map. The main reason for that is that the meridians are drawn as converging, curving lines suggesting the existence of the north and south poles.
The variety in the arrangement of the parallels that we saw in the rectangular cylindrical projections can also be seen in different non-rectangular projections. In addition, though, the degree of curvature among the different meridians will also vary significantly.
The Mollweide Projection: This projection is an equal area projection (see Purpose discussion below), so it has adjusted the positions of all meridians to eliminate area distortion. It has done so, however, at the cost of shape accuracy, scale consistency and true direction in many parts of the map.
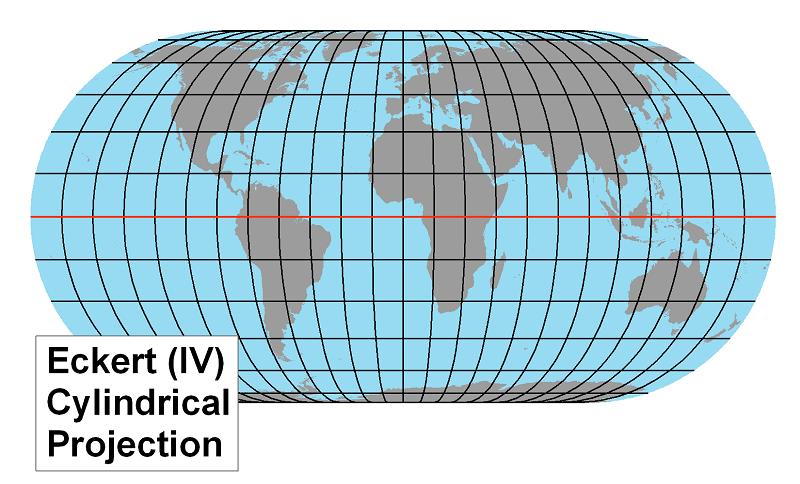
The Eckert IV Projection: This projection is also an equal area projection, with the same limitations as the Mollweide Projection but arranged somewhat differently.
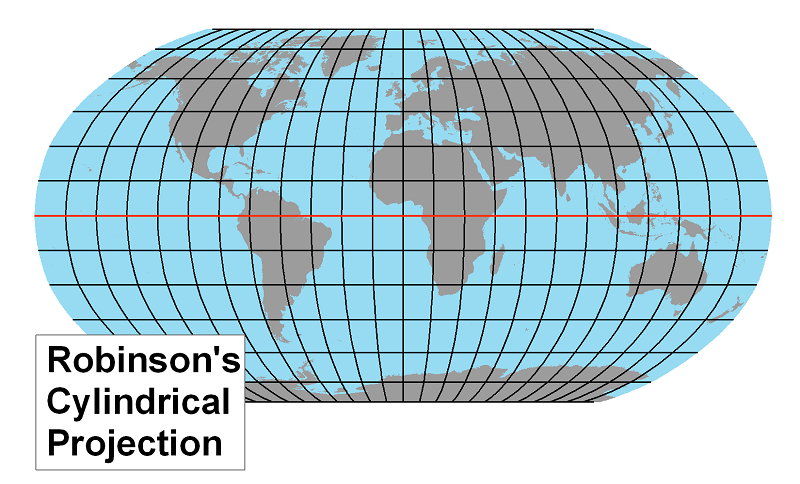
The Robinson Projection: This projection preserves none of the properties of the globe perfectly, but was designed to present a very useful combination of minor distortions. Map projections based on this approach are known as compromise projections. The Robinson Projection was chosen by the National Geographic Society as their standard projection for world maps in 1988. An unusual fact about this projection is that Robinson defined it, not via a mathematical formula, but by a large table of numbers.
The Winkel Tripel Projection: This is another compromise projection which, like Robinson's, reduces polar distortion but also preserves shapes more effectively than the two equal area projections above. In fact, the Winkel Tripel Projection replaced the Robinson Projection as National Geographic's standard world map projection in 1998.
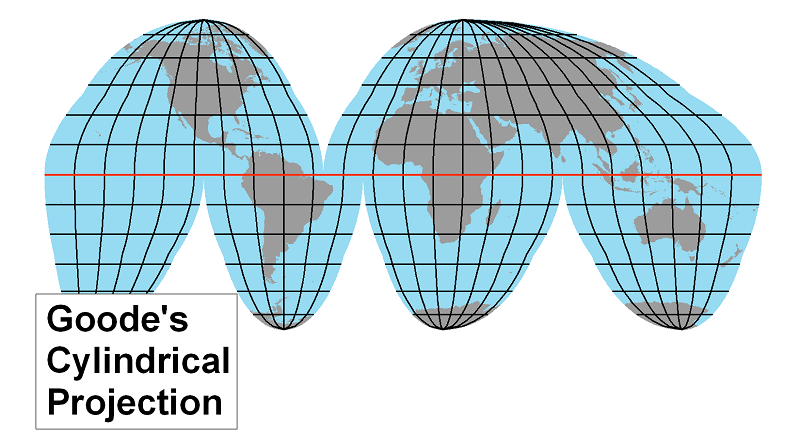
Interrupted Cylindrical Projections
The third category of Cylindrical Projections
The third category of Cylindrical Projections is the Interrupted Projections, representing an attempt to control both the excessive sizes of areas in polar regions and the distortion of their shapes. Interrupted projections are designed to avoid that distortion. Again, the defining characteristic of interrupted projections is simply the overall shape of the world map. Their defining characteristic is that the map is cut and separated (or interrupted) along certain meridians.
The same degree of variation in the arrangement of the parallels that we saw in the rectangular cylindrical projections can be seen in different non-rectangular projections. Each lobe of the globe in the northern hemisphere has its own central meridian, around which the other nearby meridians curve toward a common pole. If there are several lobes, though, it is almost suggesting that there are several north poles. The same is true for areas in the southern hemisphere, and the possibility of seeing multiple south poles.
The Goode's Interrupted Projection for Continents: This projection is probably the best representation of the sizes and shapes of land areas on any world map. Of course, it doesn't do the navigator any good because there is no clear path across the ocean. Goode's maps were most often used for thematic maps rather than topographic ones. Maps depicting land phenomena, such as statistical data about countries of the world, are very effectively depicted using this profection.
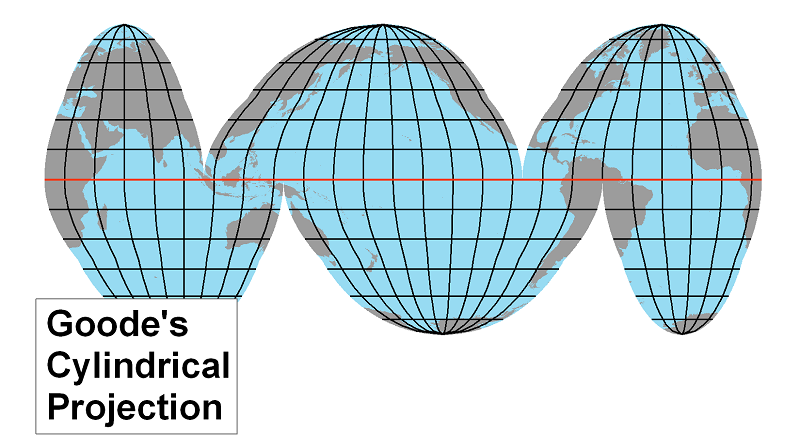
The Goode's Interrupted Projection for Oceans: This projection is also interrupted projection with the same limitations as Goode's continental projection, but with those limitations applied to the land areas instead of the oceans. With this projection, Goode developed a great means for showing details about the oceans.
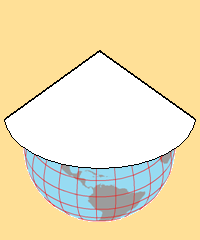
The Conic Projection
The conic projection is based on the concept of a sheet of paper wrapped into a cone placed on top of a globe so that the peak of the cone is in line with Earth's axis. Points and lines from the globe are (conceptually) able to be projected onto the cone. Then the cone is (conceptually) able to be unwrapped to a flat sheet of paper to reveal those projected lines (don't forget that it is really accomplished mathematically).
Conic projections are preferred for any map in the mid-latitudes, the area of the Earth's surface between about 30º and 60º (north or south) latitude. The continental United States falls almost entirely within that area, and all official US maps are made using conic projections. Maps of smaller areas within the US are also best represented using conic projections, including USGS topographic quadrangles, as shown in the text below, copied from the lower left corner of a typical quadrangle (USGS). The terms will be better explained on the next page.
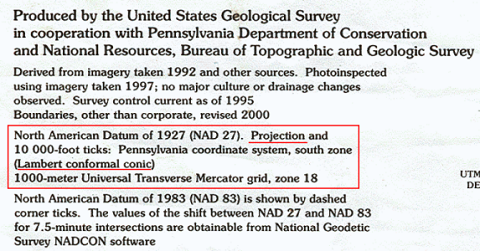
Did you notice the reference to the Mercator projection that also appears in this illustration? That is not a reference to this map's projection, but to the projection of the UTM grid that is superimposed on this map, which you learned a little more about in the last Unit.
The list below shows how the Earth and globe properties are preserved or distorted in conic projections. Notice that some properties are only distorted in some particular conic projections.
| 1. Parallels are drawn as straight lines, parallel to each other. | not valid |
| 2. Parallels are equally spaced on all meridians. | may be valid |
| 3. Meridians, the equator and other great circles are drawn as straight lines. | not valid |
| 4. Meridians converge at the poles. | probably valid (pole not visible) |
| 5. Meridians are equally spaced on each parallel, but the distances between meridians decreases from the equator to the poles. | spacing statement may be valid; distance statement is valid |
| 6. Parallels at 60° latitude are half the length of the equator, and the distance between two meridians at 60° latitude is half the distance between the same two meridians at the equator. | not valid |
| 7. Parallels and meridians cross each other at right angles. | may be valid |
| 8. The area of the surface between any two parallels and any two meridians is the same anywhere between the same two parallels and between two other meridians spaced the same as the first two. This statement also holds true for the shape of that surface area. | may be valid |
| 9. The scale of a globe is true in any direction and in any location. | not a globe |
Sample Conic Projections
Because the differences among conic projections are more subtle, the commonly-noted sub-categories are not easily recognized. For this course, therefore, you will only need to recognize a map as being in the conic category, without specifying any sub-category.
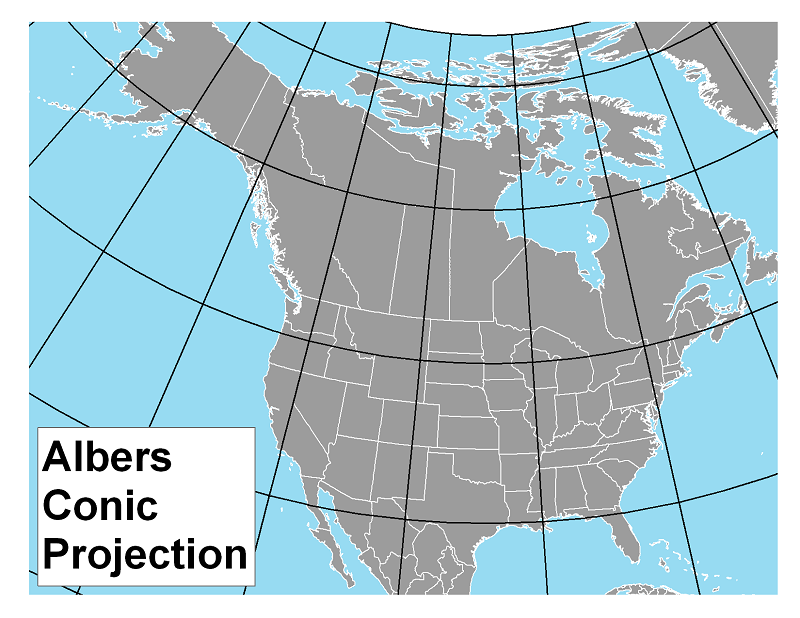
The Albers Projection: This projection is an equal area projection, so it has adjusted the positions of all meridians to eliminate area distortion. It has done so, however, at the cost of shape accuracy, scale consistency and true direction in many parts of the map.
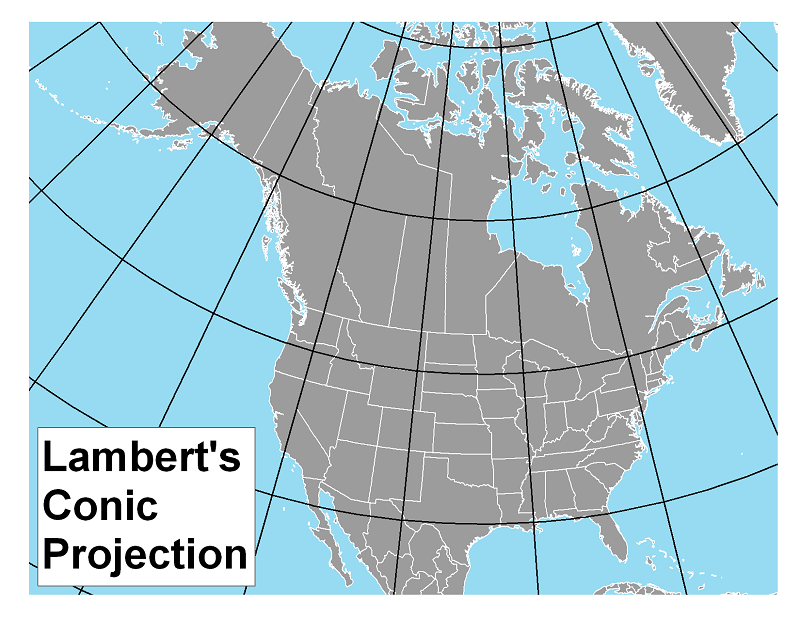
The Lambert's Projection: This projection is a conformal projection. The shapes of smaller areas of the map are retained in part by making sure that parallels and meridians cross at right angles, despite curving.
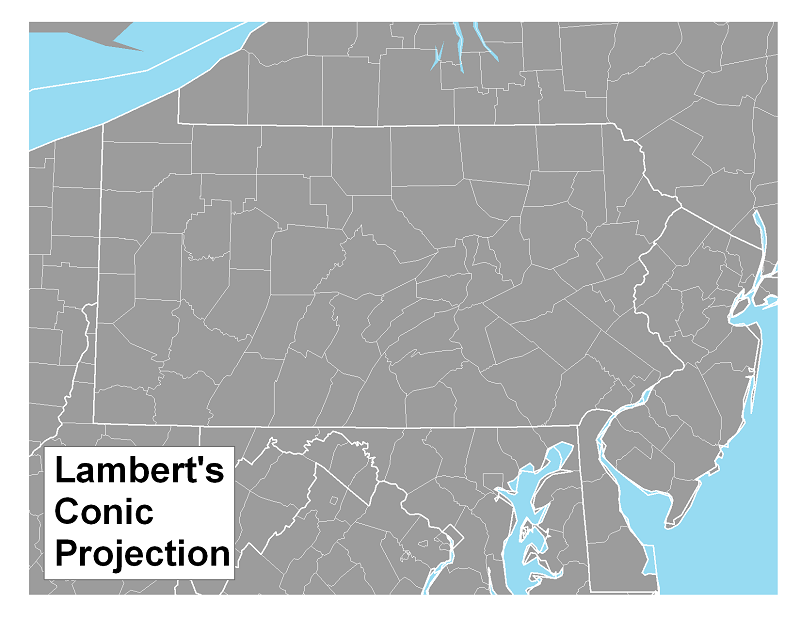
The shape of the US is seen so often that it is easier to recognize it as a mid-latitude area. Pennsylvania is obviously mid-latitude, being part of the US. It is harder to see the curvature of the meridians and parallels in a smaller area. Even though the graticule is not shown on this map, the state's western, southern and northern boundaries follow those lines.
Lambert's projection is conformal, meaning that shapes are faithfully represented. In fact, Lambert's projection is the basis for the State Plane Coordinate System for Pennsylvania.
The Planar Projection
The construction of a planar projection asumes that the sheet of paper that will hold the map is kept flat, touching the globe (conceptually) at a point. Because the sheet is kept flat, without any wrapping around the globe, the most that can be projected is one half of the Earth. For that reason, most maps based on this projection will have a characteristic circular shape, and the area depicted will usually be a "hemisphere."
If you recall, with the cylindrical and conic projections the areas of the map nearest to where the map sheet is tangent to the globe are the where the map scale is most relevant. The same is true with the planar projection but, because it is only a point of tangency instead of a line of tangency, the scale will be uncertain over a much greater portion of the map.
As with the other categories of projections there have been many particular map projections produced that are different variations on the planar projection concept. The particular projections have been organized into three sub-categories based on the location of that point of tangency: the polar planar projection, the equatorial planar projection and the oblique planar projection. As before, after you have studied the examples, you should be able to decide which sub-category any map based on a planar projection fits.
What makes a Polar Planar Projection Polar?
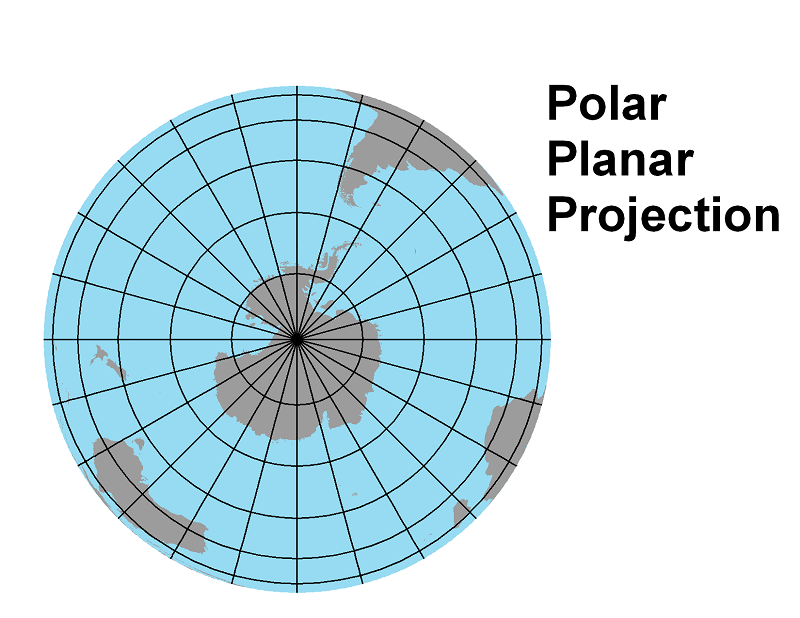
Probably the most common use of the planar projection is for a map showing the northern or southern hemisphere, as shown below, or a map showing the immediate area around the north or south pole. Variations from one particular projection to the next are primarily in the exact spacing of the parallels. In the examples below, the parallels get closer together as you move from the pole to the equator; in others, they may be evenly spaced or may be more crowded near the pole and more widely spaced near the equator.
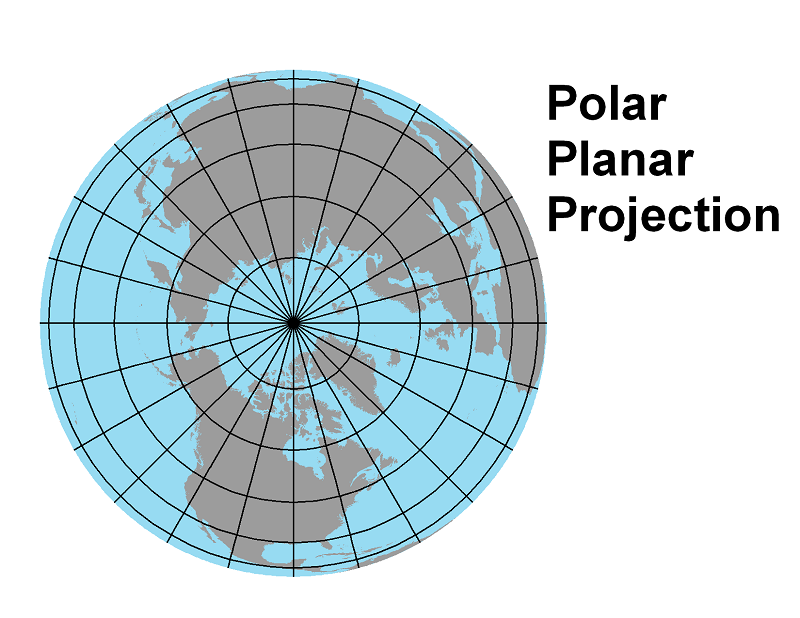
The list below shows how the Earth and globe properties are preserved or distorted in polar planar projections. Notice that some properties are only distorted in some particular polar planar projections.
| 1. Parallels are drawn as straight lines, parallel to each other. | not valid |
| 2. Parallels are equally spaced on all meridians. | may be valid |
| 3. Meridians, the equator and other great circles are drawn as straight lines. | valid only for meridian great circles |
| 4. Meridians converge at the poles. | still valid |
| 5. Meridians are equally spaced on each parallel, but the distances between meridians decreases from the equator to the poles. | still valid |
| 6. Parallels at 60° latitude are half the length of the equator, and the distance between two meridians at 60° latitude is half the distance between the same two meridians at the equator. | may be valid |
| 7. Parallels and meridians cross each other at right angles. | still valid |
| 8. The area of the surface between any two parallels and any two meridians is the same anywhere between the same two parallels and between two other meridians spaced the same as the first two. This statement also holds true for the shape of that surface area. | still valid |
| 9. The scale of a globe is true in any direction and in any location. | not a globe |
Equatorial and Oblique Planar Projections
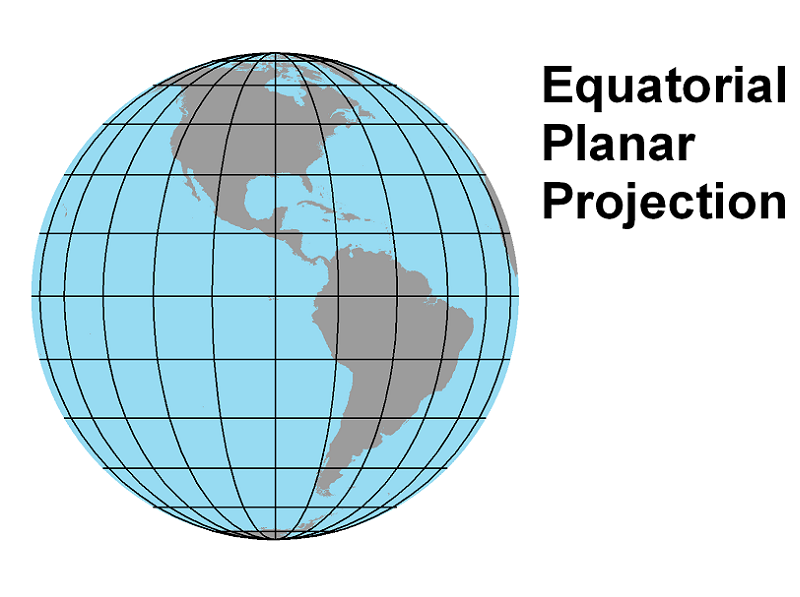
Equatorial Planar Projections: An equatorial planar projection shows one half of the world with the equator running across the middle of the map.
The Equatorial Planar Projection: An equatorial planar projection shows one half of the world with the equator running across the middle of the map. Another common use of the planar projection is to show the Eastern or Western Hemisphere (from the Prime Meridian to the International Date Line, in either direction), as shown below, or a map showing any hemisphere (180° of longitude) with the equator running horizontally across the map. Many variations are possible, altering the spacing and curvature of the meridians and parallels. In some of those variations, unlike the example here, the parallels are curved: concave upward to the north of the equator and concave downward to the south. The equator, though, will always be straight and centered.
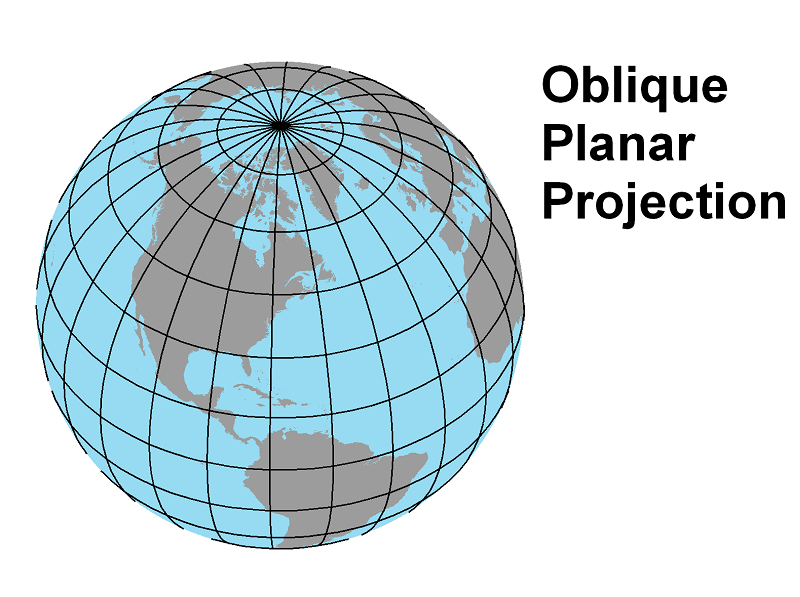
The Oblique Planar Projection: Oblique Planar Projections: An oblique planar projection shows one half of the world, or often less, centered on any location point. An oblique planar projection is centered on any point on the Earth other than the equator or either pole. Many variations are once again possible, but the parallels and meridians are usually not shown clearly enough for them to be a way to identify the particular projection. In fact, it is also not likely that you will see the entire half of the Earth centered on that point; it is more likely that the map will be zoomed in to show just the town or park or other map feature that is the focus of the map. In the map below, the focal point is Lancaster, PA.
Equatorial and Oblique Planar Projections' Characteristics
An oblique planar projection exhibits the grid characteristics shown below. The list shows how the Earth and globe properties are preserved or distorted in equatorial and oblique planar projections. Again, keep in mind that there are other possible arrangements of these two types of planar projections.
| Geodesic Characteristics | Equatorial | Oblique |
| 1. Parallels are drawn as straight lines, parallel to each other. | may be valid | not valid |
| 2. Parallels are equally spaced on all meridians. | may be valid | not valid |
| 3. Meridians, the equator and other great circles are drawn as straight lines. | valid only for the equator and the center meridian (if it is visible) | not valid |
| 4. Meridians converge at the poles. | still valid | still valid |
| 5. Meridians are equally spaced on each parallel, but the distances between meridians increases from the equator to the poles. | may be valid | not valid |
| 6. Parallels at 60° latitude are half the length of the equator, and the distance between two meridians at 60° latitude is half the distance between the same two meridians at the equator. | not valid | not valid |
| 7. Parallels and meridians cross each other at right angles. | not valid | not valid |
| 8. The area of the surface between any two parallels and any two meridians is the same anywhere between the same two parallels and between two other meridians spaced the same as the first two. This statement also holds true for the shape of that surface area. | not valid | not valid |
| 9. The scale of a globe is true in any direction and in any location. | not a globe | not a globe |
Purposes for Projections
The Mercator Projection, revisited
Mercator's Original Purpose
The Mercator Projection predated modern branches of mathematics such as calculus (used in designing some map projections) but was a mathematical solution nonetheless to a vexing navigational problem. To follow a great circle route across an ocean in order to get, say, from London to the Caribbean, navigators have to constantly change direction, and the risk of heading in the wrong direction at a particular point in the voyage was great, especially because in the 1500s they did not have reliable means of determining their longitude. That route can be plotted on a map (one that was drawn using Mercator's projection) as a straight line from London to the destination, so the navigator only had to follow one compass heading the entire trip. The resulting path, known as a "rhumb line" was not the great circle path between those points, so it was not the shortest trip, but it greatly improved the reliability of reaching that destination.
Recall the UTM Coordinate System
The UTM (Universal Transverse Mercator) coordinate system is based on a series of projected maps organized as zones, spaced at 6° intervals around the globe (the globe represents the "universal" part of the name). The projection used for each map was the "Mercator" projection, obviously. The interesting aspect of that projection design is that the zones are designed to run from the equator to each polar area. What that means is that, while the original Mercator projection was tangent to the Earth along the equator, these projections are tangent to the Earth along a meridian. The fact that meridians are at right angles to the equator is why this is called a "transverse" projection.
Since any map is a scale representation of the area mapped, it is also natural to ask about the accuracy of the map scale. The UTM coordinate system, like any cylindrically projected map, will be consistently and accurately scaled along the meridian along which the projected map is tangent and will decrease in accuracy as you move perpendicularly away from the line of tangency.
Additional Projection Purposes
The Objectives
We stated above that all map projections distort our round Earth in some way. In addition to the overall appearance and amount of Earth covered by specific map projections, there are considerations involving distortions that are minimized vs. those that are allowed. Since it is not possible to eliminate all distortions, we decide which property is most needed:
The three most commonly sought solutions to map projection distortions are:
- Preserve the relative sizes of areas throughout the map.
- Preserve relative angles, especially right angles.
- Preserve distances so the map scale is accurate.
The Solutions:
Since mathematical formulas are at the core of every map projection, those forumlas can be optimized and tested for these particular purposes. As a result, a map projection is categorized according to which property it was designed for.
- Equal Area, or Equivalent, projections preserve areas.
- Conformal projections preserve angles.
- Equidistant projections preserve distances.
There are other more subtle categories, but these are the most common. Projections generally attempt to serve one of these purposes, or they may attempt to compromise between two of them, most commonly the conformal and equivalent purposes.
The fact that Conformal Projections preserve angles means primarily that the angles at which meridians intersect parallels, which are always right angles on the Earth, will also appear as right angles in the projected map. Conformal projections, therefore, preserve property 7 from the list above. By having such angles preserved, the shapes of outlined areas on the map, such as continents and countries, are also preserved. Rectangular cylindrical projections are often chosen when this property is important. Mercator’s projection is an example of this category.
By implication, maps that are not identified as "conformal" tend to distort shapes. This happens on world maps that are identified as nonrectangular cylindrical projections. Such maps are adjusted, according to their purpose, so that parts of the world that are less important to the map’s audience end up near the outer edges of the map.
When we say that Equal Area Projections preserve areas, we mean that the relative sizes of areas are preserved. Property 8 (above) is known as the Equal Area property. The Mercator projection and other rectangular cylindrical projections are obviously poor at preserving areas. Equal area projections adjust the lengths of parallels and meridians, particularly toward the polar regions, in order reduce such exaggerated sizes. The same happens to a lesser degree in conic projections. Equal area planar projections control the spacing between parallels.
"Area" in the Equal Area maps refers to a defined area’s (such as a country’s or continent’s) absolute size, as if measured in square miles on the Earth. This property ensures that as much area as possible is sized in correct and consistent proportion to its size on Earth. It is not referring to that area’s dimensions or extent, as measured using its width vs. length in miles. Areas toward the edges of these equal area maps tend to have more distorted shapes compared to how their shape would appear if it was closer to the middle of the map.
Use Equal Area maps when it is important that countries or similar areas to be sized accurately in proportion to each other. This becomes important if the map has political implications, in which it is important not to make certain countries appear larger than their actual relative size. They are also important when displaying statistical data whose quantities are represented as densities (e.g., people per square mile).
Equidistant Projections preserve distances, but only under very specific conditions. Property 9 (above) shows that a globe is also “equidistant” in any location and direction. The most common Equidistant projected maps are some that fall in the Planar category. Where there is a specific place that can be established as the center of the map, then all other places marked on the map can be scaled to have accurate distances from that central place. It means, though, that distances between those other places are not as accurate.
Again, by implication, most maps are not equidistant. World maps in particular suffer greatly from this problem. Even though they are printed with a map scale on them, that scale is only valid along the equator and not in most of the rest of the map.
Compromise Projections represent a different kind of category because it does not achieve any one map characteristic. A compromise projection attempts to maximize two different characteristic, knowing that neither is perfect but allowing both to be as close as possible. Two well-known examples of compromise projections are the Winkel-Tripel projection and the Robinson projection.