If ![]() is a function, the second
derivative of y (or of f) is the derivative of the first
derivative. Notation:
is a function, the second
derivative of y (or of f) is the derivative of the first
derivative. Notation:
![]()
Thus,
![]()
Example. Find the second derivatives of the following functions.
(a) ![]() .
.
(b) ![]() .
.
(c) ![]() .
.
(a)
![]()
(b)
![]()
(c)
![]()
The first derivative gives information about whether a function increases or decreases. In fact:
(a) A differentiable function increases on intervals where its derivative is positive, and vice versa.
(b) A differentiable function decreases on intervals where its derivative is negative, and vice versa.
A function ![]() is concave up on an
open interval if
is concave up on an
open interval if ![]() is positive on the interval. And a function
is positive on the interval. And a function
![]() is concave down on an open
interval if
is concave down on an open
interval if ![]() is negative on the interval.
is negative on the interval.
A point where the concavity goes from up to down or from down to up is called an inflection point.
What do these conditions mean geometrically?
Consider the curve below.
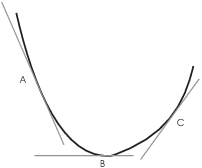
The tangent line A has negative slope, the tangent line B has zero slope, and the tangent line C has positive slope. Therefore, as you move from left to right, the slope of the tangent line increases.
But the slope of the tangent line is given by ![]() ,
and to say something increases means its derivative is positive. So
the derivative of
,
and to say something increases means its derivative is positive. So
the derivative of ![]() --- which is
--- which is ![]() --- must be positive.
By the definition, this means the curve is concave up.
--- must be positive.
By the definition, this means the curve is concave up.
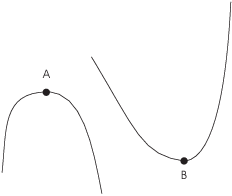
Now consider the curve below.
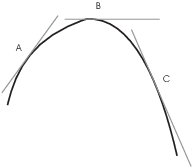
The tangent line at A has positive slope, the tangent line at B has zero slope, and the tangent line at C has negative slope. As you move from left to right, the slope of the tangent line decreases.
The slope of the tangent line is given by ![]() , and to say something
decreases means its derivative is negative. So the derivative of
, and to say something
decreases means its derivative is negative. So the derivative of ![]() --- which is
--- which is ![]() --- must be negative. By the definition,
this means the curve is concave down.
--- must be negative. By the definition,
this means the curve is concave down.
The two pictures exemplify the geometric meanings of concave up and concave down.
Example. The graph of a function is pictured below.
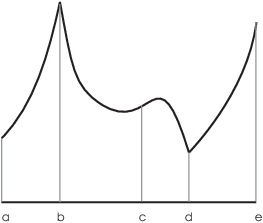
Determine the intervals on which the function is concave up and the intervals on which it is concave down. Find the x-coordinates of any inflection points.
The graph is concave up on ![]() ,
, ![]() , and
, and ![]() . The graph is concave down on
. The graph is concave down on ![]() .
.
Note that concavity is a property of a graph on an open interval, so the endpoints aren't included.
There are inflection points at ![]() and at
and at ![]() .
.![]()
Example. Find the intervals on which ![]() is concave up and the
intervals on which it is concave down. Find the x-coordinates of any
inflection points.
is concave up and the
intervals on which it is concave down. Find the x-coordinates of any
inflection points.
![]()
I set up a sign chart for ![]() , just as I use a sign chart for
, just as I use a sign chart for
![]() to tell where a function increases and where it
decreases. The break points for my concavity sign chart will be the
x-values where
to tell where a function increases and where it
decreases. The break points for my concavity sign chart will be the
x-values where ![]() and the x-values where
and the x-values where ![]() is undefined.
is undefined.
In this case, ![]() for
for ![]() and
and ![]() , and there are no
points where
, and there are no
points where ![]() is undefined. The break points are at
is undefined. The break points are at ![]() and
and ![]() .
.
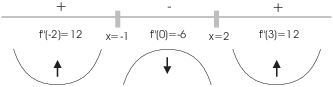
I picked numbers in each interval and plugged the numbers into ![]() . If
. If ![]() is positive, I put a "+" on the interval
and draw a concave-up curve below the interval; if
is positive, I put a "+" on the interval
and draw a concave-up curve below the interval; if ![]() is negative, I put a "-" on the interval and draw a
concave-down curve below the interval.
is negative, I put a "-" on the interval and draw a
concave-down curve below the interval.
The function is concave up for ![]() and for
and for ![]() . It is concave down for
. It is concave down for ![]() .
. ![]() and
and ![]() are inflection points.
are inflection points.![]()
Example. Find the intervals on which ![]() is concave up and the intervals
on which it is concave down. Find the x-coordinates of any inflection
points.
is concave up and the intervals
on which it is concave down. Find the x-coordinates of any inflection
points.
![]()
![]() for
for ![]() ;
; ![]() is undefined for
is undefined for ![]() .
.
The function is concave up for ![]() and for
and for ![]() . It is concave down for
. It is concave down for ![]() .
. ![]() and
and ![]() are inflection points.
are inflection points.![]()
Concavity provides way to tell whether a critical point is a max or a min --- well, sometimes. This method is called the Second Derivative Test.
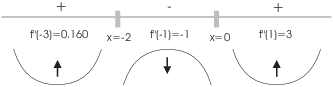
Consider a critical point where ![]() , i.e. where the tangent line
is horizontal. Here are two possibilities.
, i.e. where the tangent line
is horizontal. Here are two possibilities.
The point A is a local max; it occurs at a place where the curve is
concave down, i.e. where ![]() .
.
The point B is a local min; it occurs at a place where the curve is
concave up, i.e. where ![]() .
.
Theorem. Suppose ![]() is defined on an open
interval, and for some point c in the interval
is defined on an open
interval, and for some point c in the interval ![]() . Then:
. Then:
(a) If ![]() , then
, then ![]() is a local max.
is a local max.
(b) If ![]() , then
, then ![]() is a local min.
is a local min.
(c) If ![]() , the test fails. Try the First Derivative
Test.
, the test fails. Try the First Derivative
Test.
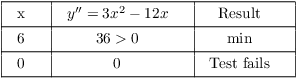
Example. Use the Second Derivative Test to
classify the critical points of ![]() .
.
![]()
The critical points are ![]() and
and ![]() .
.
Here's the graph:
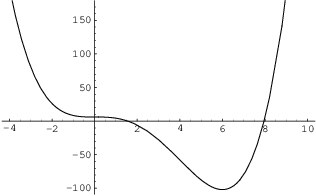
In fact, ![]() is neither a max nor a min.
is neither a max nor a min.![]()
Remark. It is not true that if ![]() (so c is a critical point) and
(so c is a critical point) and ![]() (so the Second Derivative Test fails), then
(so the Second Derivative Test fails), then ![]() is neither a max nor a min. To say the test fails means that you can
draw no conclusion, and you need to do more work. The point
could still be a max or a min!
is neither a max nor a min. To say the test fails means that you can
draw no conclusion, and you need to do more work. The point
could still be a max or a min!
For example, consider ![]() . Then
. Then ![]() and
and ![]() , so
, so ![]() and
and ![]() . Thus,
. Thus, ![]() is a critical point, and the Second Derivative Test
fails. Nevertheless,
is a critical point, and the Second Derivative Test
fails. Nevertheless, ![]() is a local min, as you can verify
by using the First Derivative Test.
is a local min, as you can verify
by using the First Derivative Test.
This example also shows that if ![]() , it does not
mean that c is an inflection point. In fact, the graph of
, it does not
mean that c is an inflection point. In fact, the graph of ![]() is always concave up, so the concavity does not
change at
is always concave up, so the concavity does not
change at ![]() .
.
Copyright 2018 by Bruce Ikenaga