Calculus provides information which is useful in graphing curves.
(i) The first derivative ![]() tells where a curve is increasing and where
a curve is decreasing.
tells where a curve is increasing and where
a curve is decreasing.
(ii) The second derivative ![]() tells where a curve is concave up
and where a curve is concave down.
tells where a curve is concave up
and where a curve is concave down.
I'll put this information together with some other techniques into a step-by-step graphing procedure. Here it is:
1. Find the domain of the function.
2. Find the x-intercepts (by setting ![]() and solving for x) and the
y-intercept (by setting
and solving for x) and the
y-intercept (by setting ![]() and solving for y).
and solving for y).
Note: There may not be any intercepts of a given kind. If it's too difficult to solve for exact x-intercepts, you may want to use a calculating device to approximate them.
3. Find the derivatives ![]() and
and ![]() .
.
4. Use a sign chart for ![]() to find where the graph increases and where
it decreases.
to find where the graph increases and where
it decreases.
5. Use the ![]() -sign chart to locate any local maxima or minima.
-sign chart to locate any local maxima or minima.
6. Use a sign chart for ![]() to find where the graph is concave up and
where it is concave down.
to find where the graph is concave up and
where it is concave down.
7. Use the ![]() -sign chart to locate any inflection points.
-sign chart to locate any inflection points.
8. By computing the appropriate limits, determine whether the graph has any vertical or horizontal asymptotes.
Check for horizontal asymptotes by computing
![]()
To locate any vertical asymptotes, look for isolated points or
endpoints which are not in the domain. If ![]() is such a point,
compute
is such a point,
compute
![]()
9. Use the information you've obtained to sketch the graph.
You might wonder why it's necessary to go through all this trouble when graphing calculators and computers can draw graphs of functions. A calculator or a computer can't tell what features of a graph are interesting to people. You can't tell a computer to focus on an interesting feature unless you know --- by methods like those above --- that the interesting feature is there to begin with!
In one of the examples, I'll use the graphing procedure on ![]() . At the end of the example is a picture of
the graph drawn by a computer. Look at the picture now. Can you tell
from the picture that there's a local max at
. At the end of the example is a picture of
the graph drawn by a computer. Look at the picture now. Can you tell
from the picture that there's a local max at ![]() ? I know there is, because calculus says so!
? I know there is, because calculus says so!
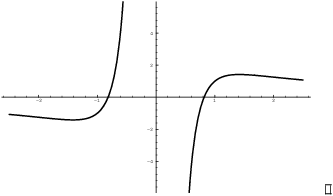
Example. Graph ![]() .
.
The domain is ![]() .
.
The x-intercepts are ![]() .
.
There is no y-intercepts.
The derivatives are:
![]()

The function increases for ![]() and for
and for ![]() . The function decreases for
. The function decreases for ![]() and for
and for ![]() .
.
The is a local max at ![]() and a local min at
and a local min at ![]() .
.

The function is concave up for ![]() and for
and for ![]() . The function is concave down for
. The function is concave down for ![]() and for
and for ![]() .
.
There are inflection points at ![]() and at
and at ![]() .
.
The graph is asymptotic to ![]() as
as ![]() and as
and as ![]() .
.
There is a vertical asymptote at ![]() :
:
![]()
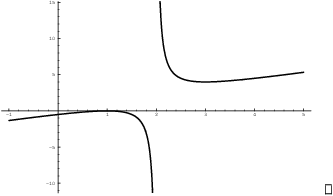
Example. Graph ![]() .
.
The domain is ![]() .
.
The x-intercept is ![]() .
.
The y-intercepts is ![]() .
.
The derivatives are
![]()

The function increases for ![]() and for
and for ![]() . The function
decreases for
. The function
decreases for ![]() and for
and for ![]() .
.
There is a local max at ![]() and a local min at
and a local min at ![]() .
.

The function is concave up for ![]() and concave down for
and concave down for ![]() .
.
There is an inflection point at ![]() .
.
There are no horizontal asymptotes.
There is a vertical asymptote at ![]() :
:
![]()
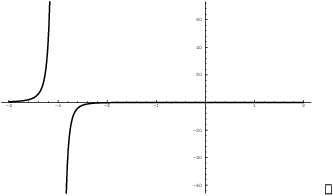
Example. Graph ![]() .
.
The domain is ![]() .
.
The x-intercept is ![]() .
.
The y-intercept is ![]() .
.
The computations of ![]() and
and ![]() are a bit messy, so you may want
to skip to the final results and go on to the increasing-decreasing
section.
are a bit messy, so you may want
to skip to the final results and go on to the increasing-decreasing
section.
To compute ![]() , I'll use the Quotient Rule. First, write the
function this way:
, I'll use the Quotient Rule. First, write the
function this way:
![]()
Differentiate:
![]()
![]()
I could compute ![]() using the Quotient Rule, but for variety
I'll use an algebra trick that is sometimes useful. Before
differentiating, I'll rewrite
using the Quotient Rule, but for variety
I'll use an algebra trick that is sometimes useful. Before
differentiating, I'll rewrite ![]() this way:
this way:
![]()
![]()
Now differentiate:
![]()
![]()
![]()
![]() for
for ![]() and
and ![]() is undefined for
is undefined for ![]() . Since the function is undefined at
. Since the function is undefined at ![]() , this point can't be a max or a min.
, this point can't be a max or a min.
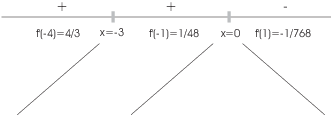
The function increases for ![]() and for
and for ![]() . The
function decreases for
. The
function decreases for ![]() .
.
There is a local max at ![]() .
.
![]() for
for ![]() and
and ![]() is undefined for
is undefined for ![]() . Since the function is undefined at
. Since the function is undefined at ![]() , this point can't be an inflection point.
, this point can't be an inflection point.

The function is concave up for ![]() and for
and for ![]() . The function is concave down for
. The function is concave down for ![]() .
.
There is an inflection point at ![]() .
.
The graph is asymptotic to ![]() as
as ![]() and as
and as ![]() .
.
There is a vertical asymptotes at ![]() :
:
![]()
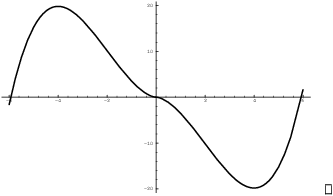
Example. Graph ![]() .
.
The domain consists of all real numbers.
The x-intercepts are ![]() .
.
The y-intercept is ![]() .
.
Here's the computation of ![]() :
:
![]()
To compute ![]() , I differentiate
, I differentiate ![]() :
:
![]()
![]() for
for ![]() ,
, ![]() , and
, and ![]() , and
, and ![]() is defined for all x.
is defined for all x.

The function increases for ![]() and for
and for ![]() . It decreases for
. It decreases for ![]() .
.
There is a local max at ![]() and a local min at
and a local min at ![]() .
. ![]() is neither a max nor a min.
is neither a max nor a min.
![]() for
for ![]() and
and ![]() , and
, and ![]() is undefined at
is undefined at ![]() . Since the function is defined at
. Since the function is defined at ![]() , there could be an inflection point there.
, there could be an inflection point there.

The function is concave up for ![]() and for
and for ![]() . It is concave down for
. It is concave down for ![]() and for
and for ![]() . There are inflection points at
. There are inflection points at ![]() ,
, ![]() , and
, and ![]() .
.
There are no vertical or horizontal asymptotes.
Example. Graph ![]() .
.
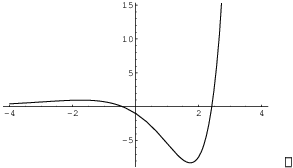
The domain is all real numbers.
The x-intercepts are
![]()
The y-intercept is ![]() .
.
The derivatives are
![]()
![]()
![]() is defined for all x.
is defined for all x. ![]() for
for ![]() .
.
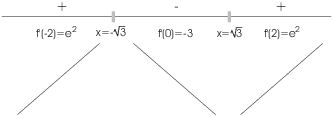
The function increases for ![]() and for
and for ![]() ; it decreases for
; it decreases for ![]() .
.
There is a local max at ![]() and a local min at
and a local min at
![]() .
.
![]() is defined for all x.
is defined for all x. ![]() for
for ![]() and for
and for ![]() .
.

The function is concave up for ![]() and for
and for ![]() ; it is concave down for
; it is concave down for ![]() .
.
![]() and
and ![]() are inflection points.
are inflection points.
There are no vertical asymptotes.
![]()
![]() is a horizontal asymptote at
is a horizontal asymptote at ![]() .
.
Copyright 2018 by Bruce Ikenaga