In this section, I'll discuss the limit of a function ![]() as x goes to
as x goes to ![]() and
and ![]() . We'll see that this is related to
horizontal asyptotes of a graph.
. We'll see that this is related to
horizontal asyptotes of a graph.
It's natural to discuss vertical asymptotes as
well, and I'll explain how these are connected to values of x where
the limit of ![]() becomes infinite.
becomes infinite.
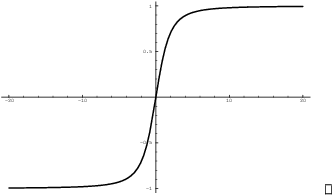
Let's start with an example. Here is the graph of ![]() :
:
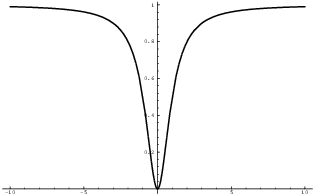
The graph approaches the horizontal line ![]() as it goes out to the left and right. You write:
as it goes out to the left and right. You write:
![]()
Here's a rough definition. If the graph of ![]() approaches
approaches ![]() as you plug in
larger and larger positive values for x, then
as you plug in
larger and larger positive values for x, then
![]()
Likewise, if the graph of ![]() approaches
approaches ![]() as you plug in larger and larger negative
values for x, then
as you plug in larger and larger negative
values for x, then
![]()
As a numerical example, consider ![]() . If you set
. If you set ![]() , you get
, you get
![]()
That's pretty close to 1, isn't it?
Here are the precise definitions. They're analogous to the ![]() definitions of ordinary limits.
definitions of ordinary limits.
Definition. ![]() means: For
every
means: For
every ![]() , there is a number M, such that:
, there is a number M, such that:
![]()
(You can give a similar definition for ![]() .)
.)
The definition says that I can make ![]() as close to L as I want, by making x sufficiently
large.
as close to L as I want, by making x sufficiently
large.
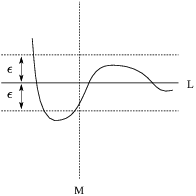
As the picture shows, values of x greater than M produce values of
![]() that lie within
that lie within ![]() of L.
of L.
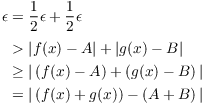
Example. Prove that ![]() .
.
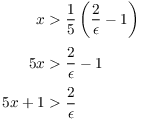
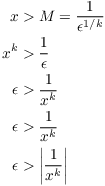
Scratch work. I'll start by working backwards
from ![]() to M.
to M.
![]()
(I can remove the absolute value bars, since ![]() means x will be large and positive.)
means x will be large and positive.)
So
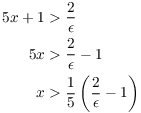
This suggests that I should take ![]() .
.
The reason for doing things this way is that you may not prove something by assuming what you want to prove. So the "working backward" part isn't by itself a valid proof: It is possible that some of the steps aren't reversible. You can ensure that everything works properly by writing the proof in the correct order, from assumptions to conclusion.
The real proof. Let ![]() . Take
. Take ![]() .
.
Then if ![]() , I have
, I have
Note that since ![]() , the last inequality implies
, the last inequality implies
![]() . So
. So

Dividing by ![]() in the first step is okay, because
in the first step is okay, because
![]() (so the inequality doesn't
"flip"). Likewise, the second step is okay, because
(so the inequality doesn't
"flip"). Likewise, the second step is okay, because ![]() , so
, so ![]() is
positive, so I can add the absolute values.
is
positive, so I can add the absolute values.
Continuing, I have
![]()
This shows that ![]() .
.![]()
Most of the properties of ordinary limits hold for limits as ![]() .
.
Theorem. (a)
![]()
(b) If k is a number,
![]()
(c)
![]()
(d) If ![]() ,
then
,
then
![]()
The statements mean that if the limits on the right side of the equation are defined, then the limits on the left sides are defined, and the two sides are equal.
Proof. I'll prove (a) by way of example. As in most limit proofs, you discover what to do by working backward ("on scratch paper"). Then you write the "real proof" forward. I'll omit the scratch work in this case.
A reminder about something before I start: I'll use the Triangle Inequality, which says that if p and q are real numbers, then
![]()
Suppose that
![]()
I want to show that
![]()
Let ![]() .
.
Since ![]() , I can
find a number M such that if
, I can
find a number M such that if ![]() , then
, then
![]()
Since ![]() , I can
find a number N such that if
, I can
find a number N such that if ![]() , then
, then
![]()
Suppose that ![]() . This means that
. This means that ![]() and
and ![]() , so both of the
, so both of the ![]() inequalities hold.
inequalities hold.
Hence, adding the inequalities, I get
(I used the Triangle Inequality in the "![]() " step.) This proves that
" step.) This proves that
![]()
Similar ideas are used in the proofs of (b), (c), and (d), though in
some cases the algebra involved is a little trickier.![]()
Here is a property that I'll use frequently.
Proposition. Let ![]() . Then
. Then
![]()
Proof. Let ![]() . I must find
a number M such that if
. I must find
a number M such that if ![]() and
and ![]() is defined, then
is defined, then
![]()
Set ![]() . Note
that
. Note
that ![]() is defined and positive, since
is defined and positive, since
![]() and
and ![]() . Suppose
. Suppose ![]() . Since M is positive, so is x, so
. Since M is positive, so is x, so ![]() is defined and positive.
is defined and positive.
I have
Hence, ![]() .
.![]()
Is it true that
![]()
It is --- provided that ![]() is defined.
What could go wrong? Suppose
is defined.
What could go wrong? Suppose ![]() . Then
. Then
![]() is
undefined, since
is
undefined, since ![]() is not defined if x is negative
and
is not defined if x is negative
and ![]() means that x is taking on negative
values. On the other hand,
means that x is taking on negative
values. On the other hand,
![]()
Here are some examples of limits at ![]() and
and ![]() .
.
Example. (a) Compute ![]() .
.
(b) Compute ![]() .
.
(c) Compute ![]() .
.
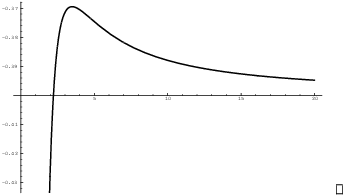
(a) In limits at infinity involving powers of x, the rule of thumb is
that the biggest powers dominate. In this case, the biggest powers on
the top and bottom are the ![]() 's. Therefore, the
limit in (a) behaves almost like
's. Therefore, the
limit in (a) behaves almost like
![]()
So you expect the answer to be ![]() .
.
On way to see this formally is to divide the top and bottom by ![]() :
:
Now as ![]() ,
,
![]()
Hence,
Here's a picture of ![]() :
:
(b)
![]()
In this case, the ![]() on top beats out the puny
on top beats out the puny ![]() on the bottom.
on the bottom.
By the way, it would be correct to say this limit diverges.
However, it's more informative to say how it diverges. In
this case, the function ![]() becomes large and negative, so you write
becomes large and negative, so you write ![]() for the limit.
for the limit.![]()
(c)
![]()
Here the ![]() on the bottom beats out the
on the bottom beats out the ![]() on the top.
on the top.![]()
Suppose that
![]()
I noted above that this means that the graph of ![]() approaches the line
approaches the line ![]() as you move to the right.
as you move to the right.
Likewise, suppose
![]()
This means that the graph of ![]() approaches the line
approaches the line
![]() as you move to the left. In these situations,
as you move to the left. In these situations, ![]() is a horizontal asymptote for
the graph of
is a horizontal asymptote for
the graph of ![]() .
.
Not all graphs have horizontal asymptotes --- for example, ![]() goes to
goes to ![]() as
as ![]() and as
and as ![]() . You can
check for the presence of horizontal asymptotes by computing
. You can
check for the presence of horizontal asymptotes by computing ![]() and
and ![]() and seeing if either is a number.
and seeing if either is a number.
Example. Find the horizontal asymptotes (if
any) of ![]() .
.
![]()
Therefore, ![]() is a horizontal asymptote for the
graph at
is a horizontal asymptote for the
graph at ![]() and at
and at ![]() . The graph is shown below:
. The graph is shown below:
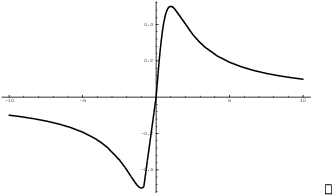
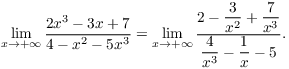
Example. Find the horizontal asymptotes of
![]() .
.
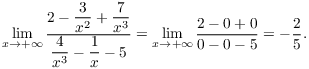
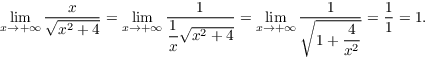
The limit at ![]() works without any surprises. The
highest power on the top and the bottom is x (since
works without any surprises. The
highest power on the top and the bottom is x (since ![]() looks like x), so divide the top and bottom by x:
looks like x), so divide the top and bottom by x:
However, the limit at ![]() is a little
tricky! Here's the computation:
is a little
tricky! Here's the computation:
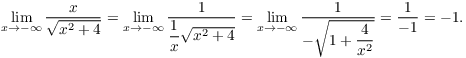
Where did that negative sign come from? Look at the bottom, which was
![]() . x is going to
. x is going to ![]() , so x is taking on negative values. Now
, so x is taking on negative values. Now
![]() is positive, so
is positive, so ![]() is negative.
is negative.
When you push the ![]() into the
square root, you must leave a negative sign outside. Otherwise, you'd
have
into the
square root, you must leave a negative sign outside. Otherwise, you'd
have ![]() , a positive thing.
, a positive thing.
Alternatively, to think of it the other way,
![]()
So if x is negative (because ![]() ), I have
), I have
![]() .
.
Thus, this is a case where it matters that x is going to ![]() , as opposed to
, as opposed to ![]() . Here's the
graph:
. Here's the
graph:
How do logarithms and exponentials behave as ![]() or
or ![]() ? The
relevant facts are summarized below.
? The
relevant facts are summarized below.
![]()
![]()
I've graphed ![]() (on the left) and
(on the left) and ![]() (on the right) below; you can see that the
pictures are consistent with the formulas above.
(on the right) below; you can see that the
pictures are consistent with the formulas above.
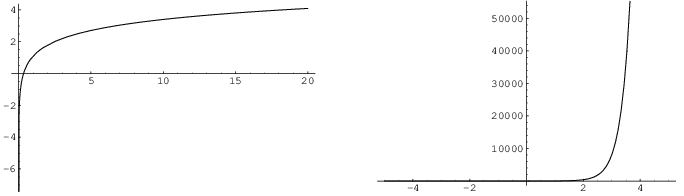
For example, the graph of ![]() goes downward
asymptotically along the y-axis from the right. This confirms that
goes downward
asymptotically along the y-axis from the right. This confirms that
![]() .
.
Likewise, the graph of ![]() rises sharply as
you go to the right; this confirms that
rises sharply as
you go to the right; this confirms that ![]() .
.
Note that if ![]() in
in ![]() , the limits are reversed. Specifically,
, the limits are reversed. Specifically,
![]()
Example. (a) Compute
![]()
(b) Compute
![]()
(c) Compute
![]()
(a)
![]()
(b)
![]()
(c)
![]()
Infinity can also appear in limits in connection with vertical asymptotes. I'll say that the graph of a
function ![]() has a vertical
asymptote at
has a vertical
asymptote at ![]() if at least one of the limits
if at least one of the limits
![]()
Example. The graph below has a vertical
asymptote at ![]() :
:
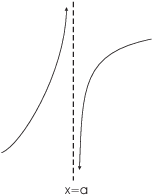
What are ![]() and
and ![]() ?
?
![]()
In general, you might suspect the presence of a vertical
asymptote at an isolated value of x for which ![]() is undefined. To confirm your
suspicion, you need to compute the left- and right-hand limits at the
point.
is undefined. To confirm your
suspicion, you need to compute the left- and right-hand limits at the
point.
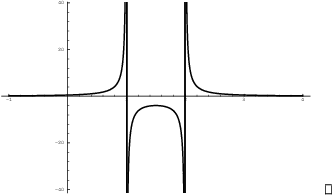
Example. Locate the vertical asymptotes of
![]() and sketch the graph near
the asymptotes.
and sketch the graph near
the asymptotes.
![]() is undefined at
is undefined at ![]() and at
and at ![]() . I'll check for vertical asymptotes by computing the
left- and right-hand limits at
. I'll check for vertical asymptotes by computing the
left- and right-hand limits at ![]() and at
and at ![]() . I'll work through the first one carefully.
. I'll work through the first one carefully.
![]()
To see this, consider numbers close to 1 but to the right of 1. Then
![]() will be positive, while
will be positive, while ![]() will be negative. For example, if
will be negative. For example, if ![]() , then
, then ![]() while
while ![]() . All together, the fraction
. All together, the fraction ![]() will be negative. But plugging
will be negative. But plugging
![]() into the fraction gives
into the fraction gives ![]() . Since the result is negative and
infinite, it must be
. Since the result is negative and
infinite, it must be ![]() .
.
You can see numerical evidence for this by plugging (e.g.) ![]() into
into ![]() .
.
![]()
This is a large negative number, which suggests that the limit is
![]() .
.
In similar fashion,
![]()
![]()
![]()
Here's the graph:
Example. ![]() is undefined at
is undefined at ![]() . Does it have a
vertical asymptote at
. Does it have a
vertical asymptote at ![]() ?
?
The fact that a function is undefined at an isolated value does not
imply that it has a vertical asymptote there. The graph of ![]() looks like this:
looks like this:
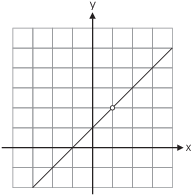
You can see this by noting that, for ![]() ,
,
![]()
Thus, the graph is the same as the graph of the line ![]() except at
except at ![]() , where there's a
hole. In other words,
, where there's a
hole. In other words,
![]()
In particular, the graph does not have a vertical asymptote at ![]() .
.![]()
Copyright 2018 by Bruce Ikenaga