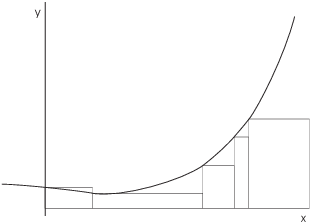
You can approximate the area under a curve using rectangles. To do this, divide the base interval into pieces ( subintervals). Then on each subinterval, build a rectangle that goes up to the curve.

What does it mean to "go up to the curve"? You have to make a choice about how the height of each rectangle depends on the curve. In the picture above, for my rectangle height I always used the height of the curve above the left-hand endpoint of each subinterval.
In the picture above, I used subintervals of different sizes. For simplicity, you will often use subintervals of the same size --- so your rectangles all have the same width. In the picture below, I've used 8 rectangles of equal widths, and for my rectangle height I always used the height of the curve above the right-hand endpoint of each subinterval.
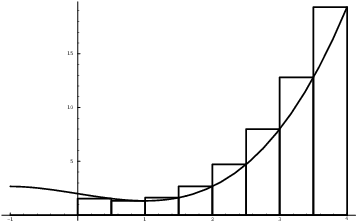
Here's an example with a specific function. I'll use ![]() . In each case, I'll use the base interval
. In each case, I'll use the base interval
![]() divided into 6 equal subintervals:
divided into 6 equal subintervals:
![]()
Here is the picture if I use the left-hand endpoint of each subinterval to get the height of each rectangle:
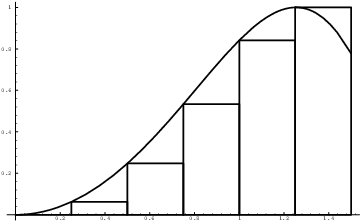
The sum of the areas of the rectangles is:
![]()
![]()
Notice that the rectangle width 0.25 factors out of the sum --- you add up the f's, then multiply by 0.25. This will always be possible if you use subintervals of equal length.
Here is the picture if I use the right-hand endpoint of each subinterval to get the height of each rectangle:
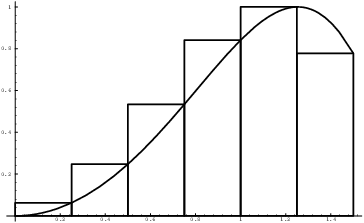
In this case, the sum of the areas of the rectangles is
![]()
![]()
Here is the picture if I use the midpoint of each subinterval to get the height of each rectangle:

The midpoints of the subintervals are:
![]()
In this case, the sum of the areas of the rectangles is
![]()
![]()
By comparison, the actual area under the curve is around 0.778238.
You can get better approximations by taking more rectangles. For example, here is the left-hand endpoint picture with 50 rectangles:
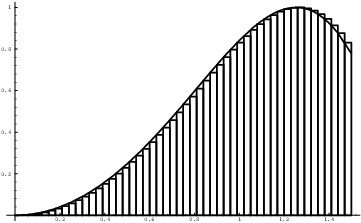
Notice how much better the rectangles approximate the area under the curve.
With 200 rectangles, the left-hand endpoint sum is 0.775311, the right-hand endpoint sum is 0.781147, and the midpoint sum is 0.778242. The three values are close to the actual value 0.778238.
Example. Approximate the area under ![]() for
for ![]() , using 20
circumscribed rectangles of equal width.
, using 20
circumscribed rectangles of equal width.
Circumscribed means that you should use the largest function value on each interval to get the height of a rectangle. My subintervals are
![]()
In general, it can be difficult to determine where the largest
function value is. However, by graphing ![]() on
on ![]() , you can see that the largest
function value for each subinterval occurs at the left-hand endpoint.
, you can see that the largest
function value for each subinterval occurs at the left-hand endpoint.
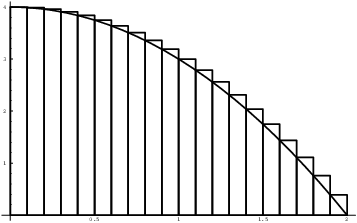
So I use
![]()
![]()
![]()
I continue in this fashion, all the way up to
![]()
I can write these points as
![]()
So my function values are
![]()
These are the rectangles heights. Each height is multiplied by a width of 0.1. The total is
![]()
![]()
Now the sum is in a form you can evaluate on your calculator. You
should get 5.53; the actual value is ![]() .
.![]()
Example. Approximate the area under ![]() from
from ![]() to
to ![]() using 20 equal subintervals and evaluating the
function at the left-hand endpoints.
using 20 equal subintervals and evaluating the
function at the left-hand endpoints.

You can use a calculator to approximate this sum; it's around
0.84799.![]()
In the preceding examples, I've assumed that the subintervals (which give the widths of the rectangle) are the same size. I've also chosen the evaluation points systematically --- left-hand endpoints, right-hand endpoints, midpoints. These are conveniences to make setting up the computations simple.
In general, the subintervals don't have to be the same size, and I
don't have to choose the evaluation points systematically. For
example, here is an approximation to the area under ![]() from
from ![]() to
to ![]() .
.
![$$\vbox{\offinterlineskip \halign{& \vrule # & \strut \hfil \quad # \quad \hfil \cr \noalign{\hrule} height2pt & \omit & & \omit & & \omit & & \omit & \cr & interval & & x & & $f(x)$ & & $f(x)\cdot\Delta x$ & \cr height2pt & \omit & & \omit & & \omit & & \omit & \cr \noalign{\hrule} height2pt & \omit & & \omit & & \omit & & \omit & \cr & $[0,2]$ & & 1.0 & & 1.0 & & 2.0 & \cr height2pt & \omit & & \omit & & \omit & & \omit & \cr \noalign{\hrule} height2pt & \omit & & \omit & & \omit & & \omit & \cr & $[2,3]$ & & 2.8 & & 7.84 & & 7.84 & \cr height2pt & \omit & & \omit & & \omit & & \omit & \cr \noalign{\hrule} height2pt & \omit & & \omit & & \omit & & \omit & \cr & $[3,3.5]$ & & 3.0 & & 9.0 & & 4.5 & \cr height2pt & \omit & & \omit & & \omit & & \omit & \cr \noalign{\hrule} height2pt & \omit & & \omit & & \omit & & \omit & \cr & $[3.5,6]$ & & 5.0 & & 25.0 & & 37.5 & \cr height2pt & \omit & & \omit & & \omit & & \omit & \cr \noalign{\hrule} height2pt & \omit & & \omit & & \omit & & \omit & \cr & sum & & & & & & 51.84 & \cr height2pt & \omit & & \omit & & \omit & & \omit & \cr \noalign{\hrule} }} $$](rectangle-sums39.png)
This gives an approximate area of 51.84. The actual area is 77.
Copyright 2018 by Bruce Ikenaga