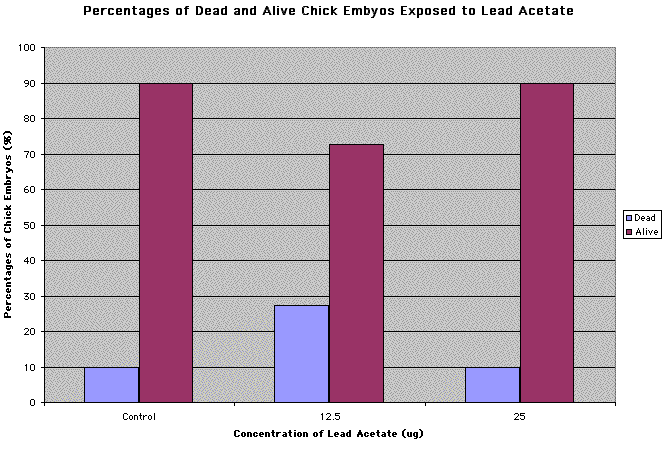
Table 1: The number of alive and dead chick embryos exposed to different concentrations of lead for all attempted experiments.
|
12.5ug |
25ug |
50ug |
100ug |
Control |
|
|
Alive |
8 |
9 |
1 |
0 |
11 |
|
Dead |
3 |
1 |
5 |
6 |
1 |
|
Total Embryos |
11 |
10 |
6 |
6 |
12 |

(Return
to Discussion)
© Cebra-Thomas, 2001
Last Modified: 31 May 2001
[Lab
Protocols
| Students
| Cebra-Thomas
| Course
| Links
]