Consider the iterated integral
![]()
It can be computed by integrating with respect to x first or with respect to y first. In some cases, one order is better than the other. For this reason, it's useful to know how to go from a "bad" order of integration to a "good" order of integration.
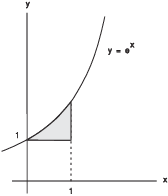
Example. Compute ![]() .
.
As the integral is given, I'd need to integrate first with respect to
x. However, I don't know the antiderivative of ![]() . I'll interchange the order of
integration and integrate first with respect to y.
. I'll interchange the order of
integration and integrate first with respect to y.
Step 1: Pull off the limits of integration as inequalities.
![]()
Step 2: Draw the region defined by the inequalities.

Step 3: Describe the region by inequalities with the variables in the opposite order.
In the first set of inequalities, y came first. In this set, x will
come first. For x, I can take the numerical bounds in the
x-direction: ![]() .
.
Next, I need the inequalities for y. y is the vertical
variable, so it will be bounded by expressions for the bottom
curve and the top curve of the region. The bottom curve
is the x-axis, which is ![]() . The top curve is
. The top curve is
![]() . Since I'm bounding y, I need to express y
in terms of x. Thus,
. Since I'm bounding y, I need to express y
in terms of x. Thus, ![]() .
.
Therefore, the inequalities for y are ![]() . The new set of inequalities is
. The new set of inequalities is
![]()
Step 4: Put the inequalities back onto the integral:
![]()
![]()
Schematically, here's what's going on:
![]()
This is similar to the procedure for converting a double integral to polar coordinates.
Example. Compute the integral by interchanging the order of integration:
![]()
Pull off the limits as inequalities:
![]()
Next, draw the region determined by the inequalities. The
inequalities ![]() imply that the region lies
in the horizontal strip between
imply that the region lies
in the horizontal strip between ![]() (bottom) and
(bottom) and ![]() (top).
(top).
The inequalities ![]() give the
left-hand and right-hand boundaries, because x is
the horizontal variable. The left-hand curve is
give the
left-hand and right-hand boundaries, because x is
the horizontal variable. The left-hand curve is ![]() , or
, or ![]() . The right-hand curve is
. The right-hand curve is ![]() . The region is shown above.
. The region is shown above.
Next, describe the region by inequalities with the variables
switched. I'll do x first, since the first set of inequalities had
the number bounds on y. The numerical bounds on x are 0 and 1, so
![]() .
.
To get the bounds on y, I look at the bottom curve and the
top curve. The bottom curve is the line ![]() . The top curve is
. The top curve is ![]() . Hence, the inequalities for y are
. Hence, the inequalities for y are ![]() .
.
The new inequalities are
![]()
Put the inequalities back onto the integral:
![]()
![]()
![]()
![]()
Example. Express the following sum as a single iterated integral by interchanging the order of integration:
![]()
Pull off the limits as inequalities:
![]()
Draw the region determined by the inequalities.

Describe the region by inequalities with the variables switched:
![]()
Put the new inequalities back onto the integral:
![]()
Example. Compute ![]() .
.
Pull off the limits as inequalities:
![]()
Draw the region determined by the inequalities.

Describe the region by inequalities with the variables switched:
![]()
Put the new inequalities back onto the integral:
![]()
![]()
![]()
Copyright 2018 by Bruce Ikenaga